


To open long positions on EURUSD, you need:
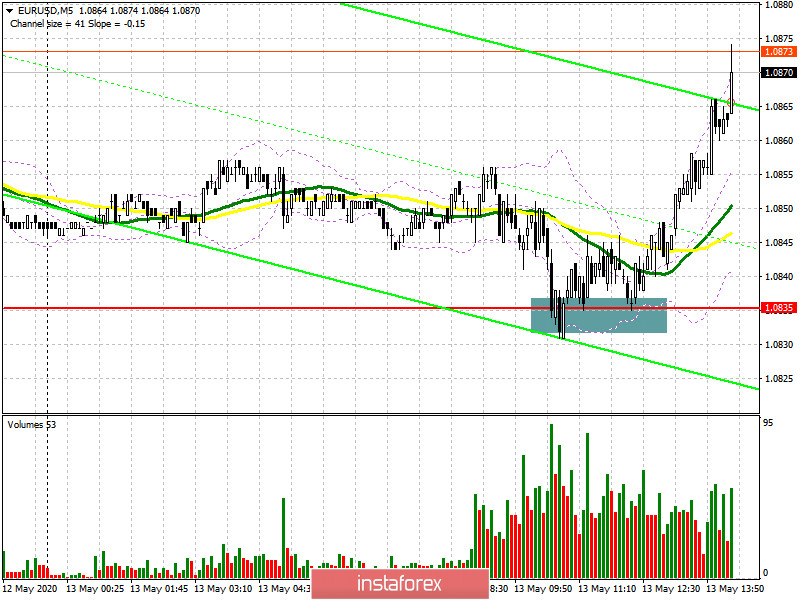
In my morning forecast, I paid attention to the level of 1.0835 and its high importance in terms of continuing the upward correction of the euro. If you carefully look at the 5-minute chart, you will see how after the formation of a false breakdown at this level with a repeated test of it on the volume, it was possible and necessary to open long positions and wait for the continuation of the upward movement in the first half a day. Good indicators on the reduction of industrial production, which was better than the forecasts of economists, led to the strengthening of the euro in the first half of the day. At the moment, an important goal is to break through and consolidate above the resistance of 1.0881, which will lead to a more powerful bullish impulse with an exit to the highs of 1.0923 and 1.0972, where I recommend fixing the profits. In the scenario of a repeated decline of EUR/USD to the support area of 1.0835 after the speech of the US Federal Reserve Chairman Jerome Powell, which will take place in the afternoon, it is best to postpone buying the euro until the test of the lower border of the side channel 1.0787 or open long positions immediately on a rebound from the new local minimum of 1.0728 in the calculation of an upward correction of 30-40 points within the day.
To open short positions on EURUSD, you need:
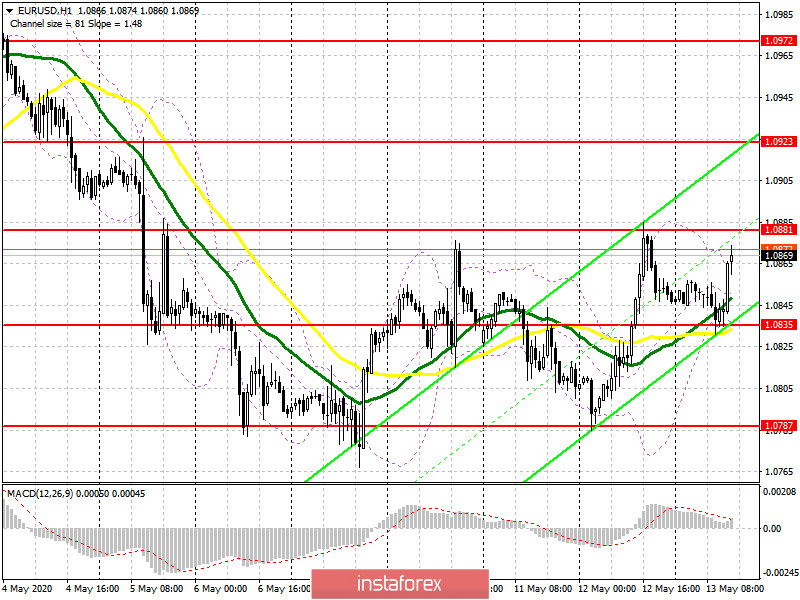
Sellers need to return to the market, and it will be possible to talk about control from their side only after the pair is fixed below the support of 1.0835, which was not possible in the first half of the day. Only in this scenario, you can open new short positions in the expectation of a repeated decline in EUR/USD in the area of this week's minimum to the support of 1.0787, as well as its breakdown, which will increase pressure on the euro and lead to an update of the area of 1.0728, where I recommend fixing the profits. If, after a speech by the head of the Fed, the market does not start moving down, and the formation of a false breakdown in the resistance area of 1.0881 does not lead to a larger decrease in the euro, it is best to postpone short positions until the test of larger highs in the areas of 1.0923 and 1.0972 counting on correction of 25-30 points intraday.
Signals of indicators:
Moving averages
Trading is above the 30 and 50 daily moving averages, which indicates a possible continuation of the euro's growth in the short term.
Note: The period and prices of moving averages are considered by the author on the hourly chart H1 and differ from the general definition of the classic daily moving averages on the daily chart D1.
Bollinger Bands
A break in the upper limit of the indicator around 1.0865 may lead to a larger increase in the euro. Bears will return to the market only after breaking the lower border of the indicator in the area of 1.0835.
Description of indicators
- Moving average (moving average determines the current trend by smoothing out volatility and noise). Period 50. The graph is marked in yellow.
- Moving average (moving average determines the current trend by smoothing out volatility and noise). Period 30. The graph is marked in green.
- MACD indicator (Moving Average Convergence / Divergence - moving average convergence / divergence) Fast EMA period 12. Slow EMA period 26. SMA period 9
- Bollinger Bands (Bollinger Bands). Period 20


