


To open long positions on GBPUSD, you need:
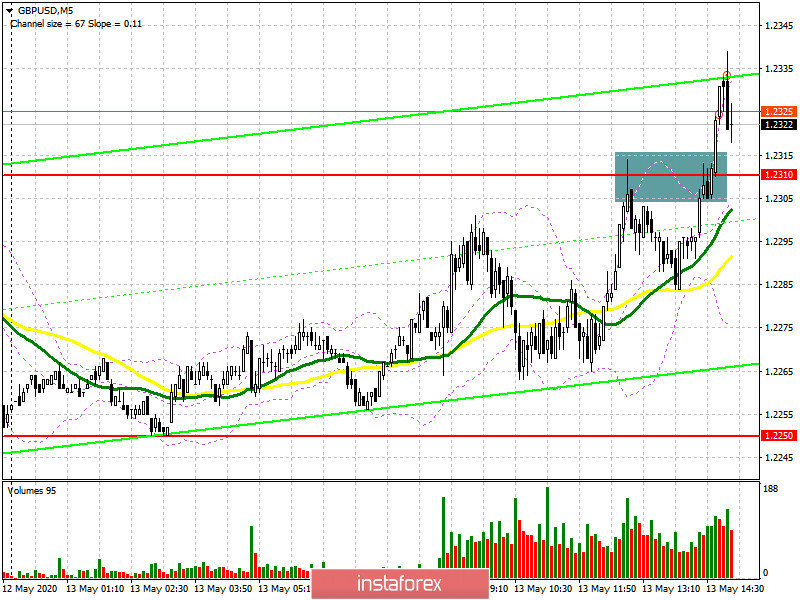
In the first half of the day, I paid attention to the level of 1.2310 and the formation of a false breakout from this range, which would allow sellers of the pound to continue the downward trend. If you look at the 5-minute chart, we see how after the test of this resistance, the pair rolled down more than 25 points, but the data on the reduction of the growth rate of UK GDP stopped its downward trend, as it turned out much better than forecasts of economists, reinforcing the risk appetite. A repeated test of the resistance of 1.2310 has already led to a breakout of this level, and all that is now required for buyers is to fix above this range and update it from top to bottom on the volume, which will be a signal to open long positions in the expectation of continuing the upward correction. However, much still depends on the speech of US Federal Reserve Chairman Jerome Powell, which will take place in the afternoon. The next target of the bulls will be the resistance of 1.2370, after updating which I recommend fixing the profit. In the scenario of GBP/USD falling below the support level of 1.2301 in the second half of the day, it is best to postpone long positions until the test of the minimum of 1.2250 or buy the pair immediately for a rebound from the support of 1.2211 in the calculation of an upward correction of 30-40 points within the day.
To open short positions on GBPUSD, you need:
In the first half of the day, the bears tried to hold the resistance of 1.2310, and it seemed that they succeeded, but at the second test of this level, active sales did not occur, which led to the breakdown of this range and the demolition of stop orders of speculative players. The sellers' task for the second half of the day will be to return to the level of 1.2310, which will increase the pressure on the pound and quickly push it down to the major support of 1.2250. However, the bears' longer-term goal for the end of this week remains the lows of 1.2211 and 1.2169, where I recommend fixing the profits. In the scenario of further growth of the pound, which may occur after the speech of Fed Governor Jerome Powell, short positions can be returned only after the formation of a false breakout in the area of 1.2370, but I recommend selling GBP/USD immediately for a rebound only after testing the maximum of 1.2325 in the calculation of a downward correction within the day of 30-40 points.
Signals of indicators:
Moving averages
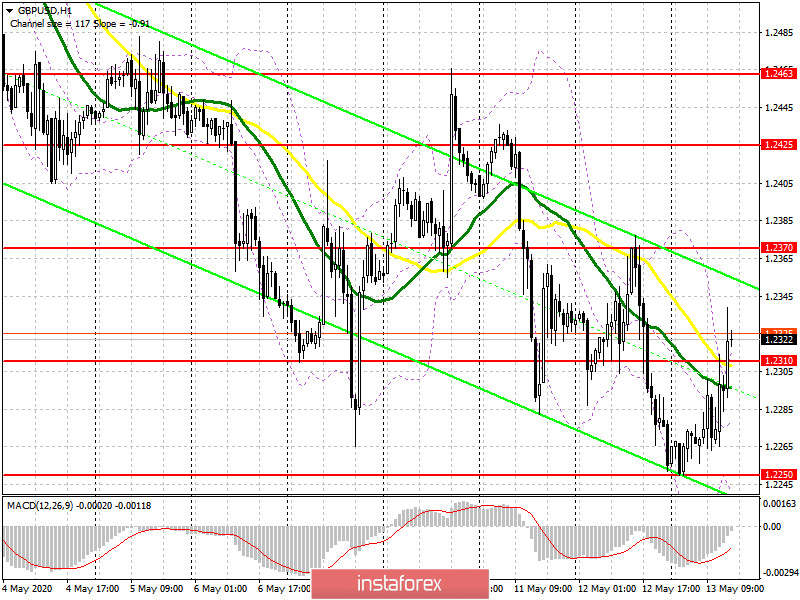
Trading is just above the 30 and 50 daily averages, which indicates an attempt by the bulls to return to the market, which is still owned by the bears.
Note: The period and prices of moving averages are considered by the author on the hourly chart H1 and differ from the general definition of the classic daily moving averages on the daily chart D1.
Bollinger Bands
The break of the upper limit of the indicator in the area of 1.2300 once again confirms the firmness of buyers' intentions to continue the upward correction. In case of a decline, the lower border of the indicator in the area of 1.2250 will provide support.
Description of indicators
- Moving average (moving average determines the current trend by smoothing out volatility and noise). Period 50. The graph is marked in yellow.
- Moving average (moving average determines the current trend by smoothing out volatility and noise). Period 30. The graph is marked in green.
- MACD indicator (Moving Average Convergence / Divergence - moving average convergence / divergence) Fast EMA period 12. Slow EMA period 26. SMA period 9
- Bollinger Bands (Bollinger Bands). Period 20


