To open long positions on GBP/USD:
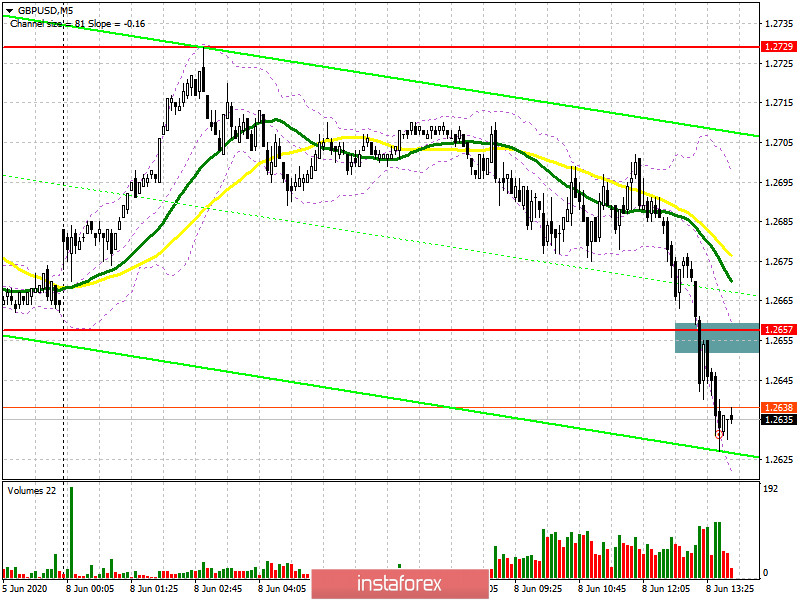
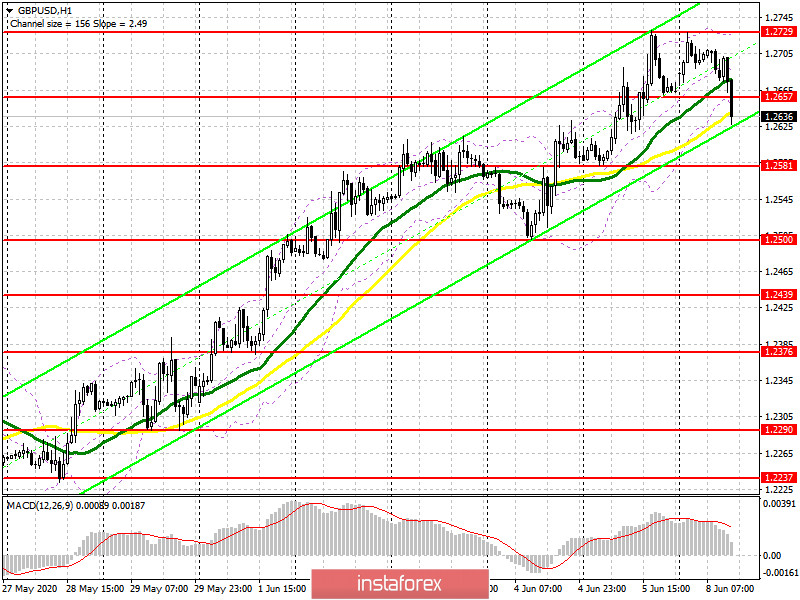
Nothing important happened in the first half of the day. Bears have only tried to break below the support level of 1.2657, where now they need to consolidate. If you take a look at the 5-minute chart, you will see a breakout of the level of 1.2657. However, in order to make an actual sell signal, it is necessary to test this area from the bottom up. A more active sell-off of GBP/USD may begin. If the price does not fall quickly from this level, buyers are likely to try to return the market under their control. If they manage to do this, the morning scenario may unfold, where the bulls' target has been the resistance level of 1.2729. Consolidation is unlikely to be a clear signal for the continuation of the bullish trend with the new highs at around 1.2798 and 1.2840, where it is preferable to take profit. If the GBP/USD pair declines further in the second half of the day, buyers are likely to count on support of 1.2581. This is the level where you can open long positions immediately on a rebound in the expectation of a 30-40 pips upward correction within the day.

To open short positions on GBP/USD:
An important task for bears in the second half of the day will be to protect the resistance level of 1.2657, which is likely to only increase the pressure on the pair and lead to a larger sell-off in the area of the 1.2581 low. However, in the middle of the week, the farther target of sellers will be the area of 1.2500, where it is better to take profit. If the bulls manage to return to the market in the second half of the day and retake the level of 1.2657, it is best to close short positions and wait for new signals. One of them may be the formation of a false breakdown at the resistance level of 1.2729. If the price breaks out at this level, it is best to refrain from short positions to the test of the 1.2798 high. Otherwise, it is better to sell the GBP/USD immediately on a rebound from a larger resistance level of 1.2840 in the expectation of a 30-40 pips downward movement by the closing of the day.

Signals of indicators:
Moving averages
Trading is carried out in the region of 30 and 50 daily averages, which indicates another bears' attempt to resume a downward correction.
Note: The period and prices of moving averages are considered by the author on the hourly chart and differ from the general definition of the classic daily moving averages on the daily chart.
Bollinger bands
In case of a breakthrough of the upper border of the indicator at 1.2729, demand for the pound may increase. Meanwhile, bears are trying to cope with the breakdown of the lower border of the indicator at 1.2655.
Description of indicators
Moving average (MA) determines the current trend by smoothing out volatility and noise. Period 50. MA is colored in yellow on the chart.
Moving average (MA) determines the current trend by smoothing out volatility and noise. Period 30. MA is colored in green on the chart.
MACD (Moving Average Convergence/Divergence). Fast EMA period 12. Slow EMA period 26. SMA period 9
Bollinger Bands. Period 20


