


To open long positions on EURUSD, you need:
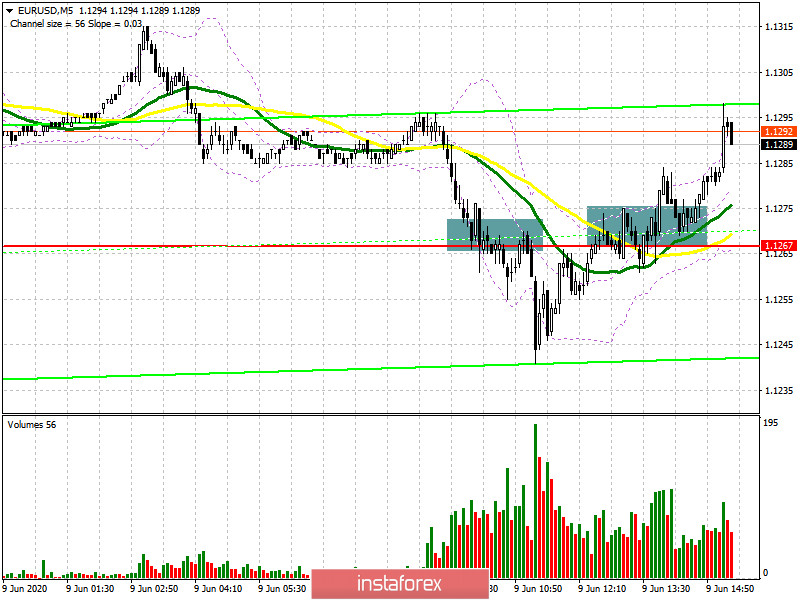
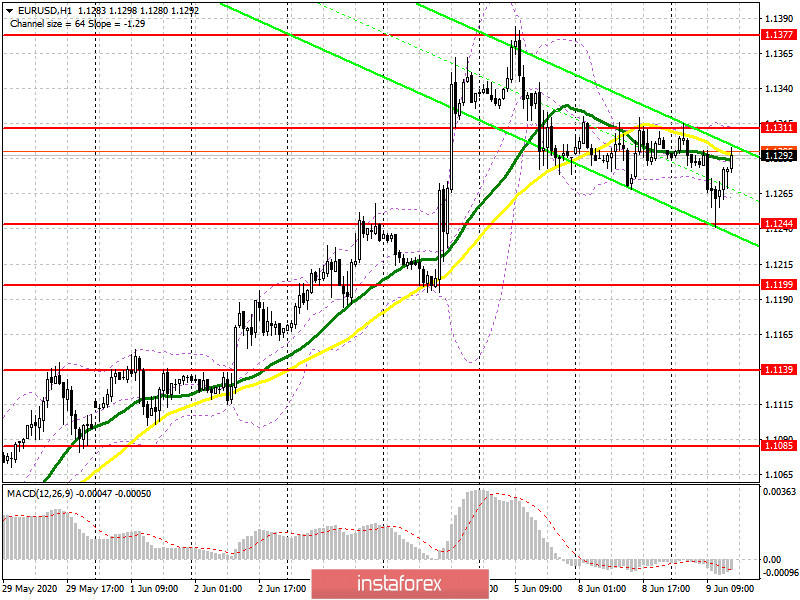
In the first half of the day, I paid attention to the level of 1.1267, from which several signals were formed at once for entering the market. If you look at the 5-minute chart, you will see how the bears tried to break below this range, however, their momentum was not supported by major players, which eventually led to a drawdown of the market from this level by no more than 30 points. Already, closer to the second half of the day, the bulls regained the area of 1.1267, having fixed on it, which is also visible on the 5-minute chart. This was a signal to open long positions. Until the moment when trading will be conducted above the range of 1.1267, we can expect the euro to continue growing in the area of a new resistance of 1.1311. However, only a breakdown and consolidation above this level will allow buyers of EUR/USD to expect the pair to return to the highs of last week in the area of 1.1377. The longer-term goal is the resistance of 1.1422, where I recommend fixing the profits. If the pressure on the euro returns in the second half of the day after the macroeconomic statistics on the US economy, it is best to postpone long positions until the formation of a false breakout in the resistance area of 1.1244 or buy EUR/USD immediately on the rebound from the minimum of 1.1199.
To open short positions on EURUSD, you need:
The bears missed their chance and retreated from the level of 1.1267, which is clearly visible on the chart. The data on the decline in Eurozone GDP was slightly better than the forecasts of economists, which did not allow building a more powerful downward momentum in the euro. At the moment, the task of sellers is to protect the resistance of 1.1311, and only the formation of a false breakout on it will be a signal to open short positions. The immediate goal of sellers will be the support of 1.1244, the breakdown of which will definitely increase the pressure on the pair, which will lead to a test of the minimum of 1.199, where I recommend fixing the profits. If the bulls manage to break above the resistance of 1.1311, then I recommend returning to short positions only for a rebound from the high of last week in the area of 1.1377 in the expectation of correction of 30-40 points by the close of the day.
Signals of indicators:
Moving averages
Trading is conducted in the area of 30 and 50 daily moving averages, which indicates that the bears are trying to continue the downward correction.
Note: The period and prices of moving averages are considered by the author on the hourly chart H1 and differ from the general definition of the classic daily moving averages on the daily chart D1.
Bollinger Bands
A break in the lower border of the indicator around 1.1260 will increase pressure on the euro. A break in the upper limit of the indicator in the area of 1.1310 may return new buyers to the market, who are counting on the continuation of the bull market.
Description of indicators
- Moving average (moving average determines the current trend by smoothing out volatility and noise). Period 50. The graph is marked in yellow.
- Moving average (moving average determines the current trend by smoothing out volatility and noise). Period 30. The graph is marked in green.
- MACD indicator (Moving Average Convergence / Divergence - moving average convergence / divergence) Fast EMA period 12. Slow EMA period 26. SMA period 9
- Bollinger Bands (Bollinger Bands). Period 20


