


Hello, dear colleagues!
According to the results of trading on June 8-12, a rather curious picture has developed. All commodity currencies showed strengthening against the US dollar, while the rest declined. This situation again suggests a continuing risk appetite among investors.
Weekly
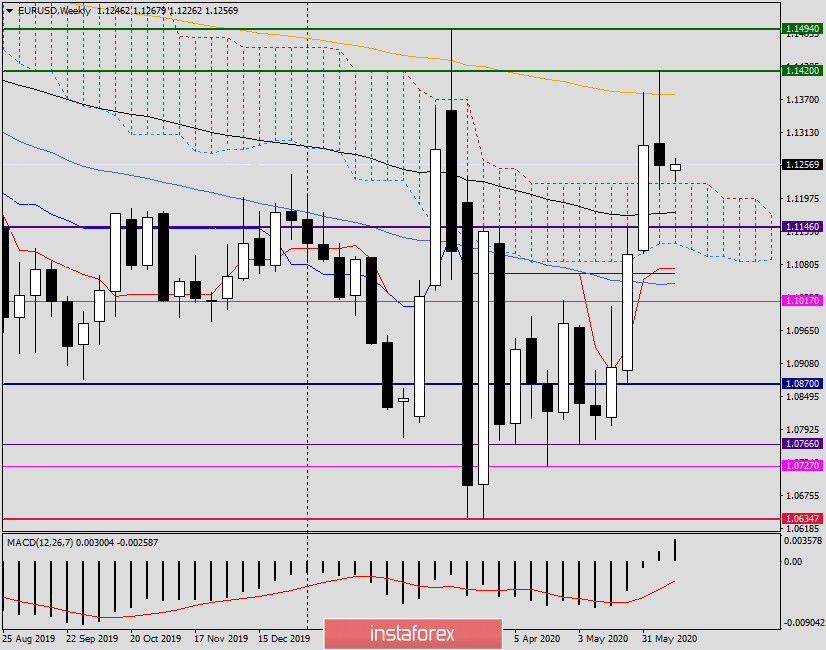
If you go to the main currency pair of the Forex market, it lost 0.47% at the end of the last trading, which is not so much. It is much more important what the weekly candle turned out to where exactly it appeared. Let's figure it out.
So, the chart shows that the stumbling block for the euro bulls was the 200 exponential moving average, which blocked the road in the north direction. Last week, the euro bulls did not give up trying to break above the 200 EMA and even updated the previous highs at 1.1383, raising the quote to 1.1420. By the way, both levels were previously mentioned as quite strong, which was confirmed during the auction.
The pair failed to overcome 1.1420 and gain a foothold above 1.1400, after which it turned into a decline, ending the weekly session at 1.1254. The shape of the last weekly candle is also characteristic. The model can be considered a reversal, and its too long upper shadow only emphasizes the weakness of the bulls. Perhaps the only positive moment for the players to increase was the closing of the week above the cloud of the Ichimoku indicator.
Daily
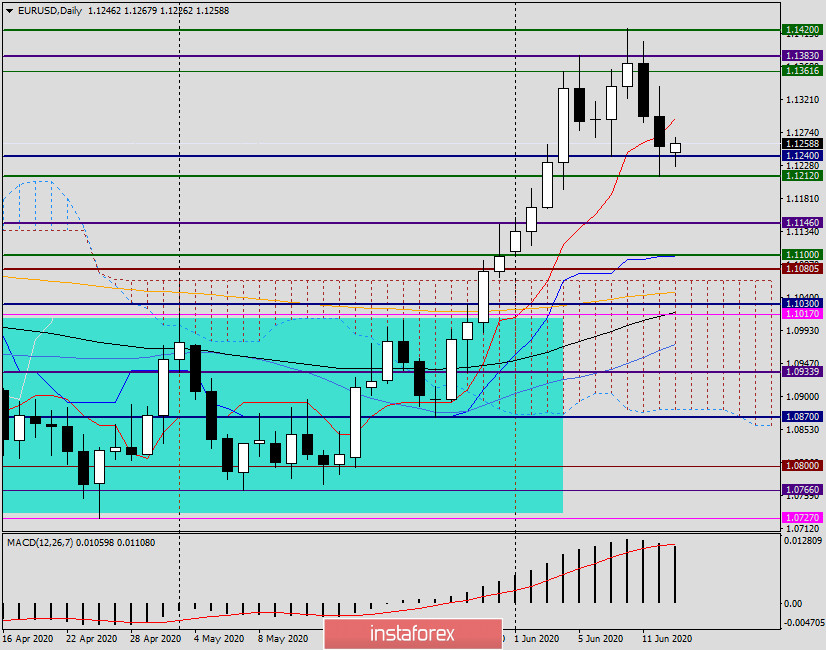
Today's trading for EUR/USD is under moderate pressure and the pair is trading near 1.1240. In favor of the bears is the fact that Friday's trading was closed under the Tenkan line. In general, the last two bearish candles indicate that the pair is being reversed. This assumption will be confirmed by the census of previous lows at 1.1212 and a confident consolidation under 1.1200.
The nearest targets at the bottom can be considered 1.1212, 1.1200, 1.1180, and 1.1150. In order for players to have a chance to improve the rate, they need to go up the Tenkan line (1.1294) and fix themselves above the important and significant level of 1.1300. If this happens, the next top targets will be 1.1360 and 1.1380. A true breakdown of the last mark will give you a chance to once again test the strong resistance of sellers in the area of 1.1400-1.1422 for a breakdown. At this point in time, judging by the two charts considered, the downward scenario looks the most preferable.
In my personal opinion, it is better to look at the opening of short positions after short-term bounces up. I recommend selling EUR/USD after rising to the price zone of 1.1270-1.1300. You can not ignore the alternative option, that is, purchases. If there will be reversal patterns of Japanese candles on the daily, four-hour or hourly charts in the price zone of 1.1220-1.1180, you can try neat purchases with a small stop and profit. However, at the moment, the priority is sales.
In future reviews, we will pay more attention to the macroeconomic data that will be published this week. No important statistics are planned for today.
Good luck!


