


To open long positions on GBPUSD, you need:
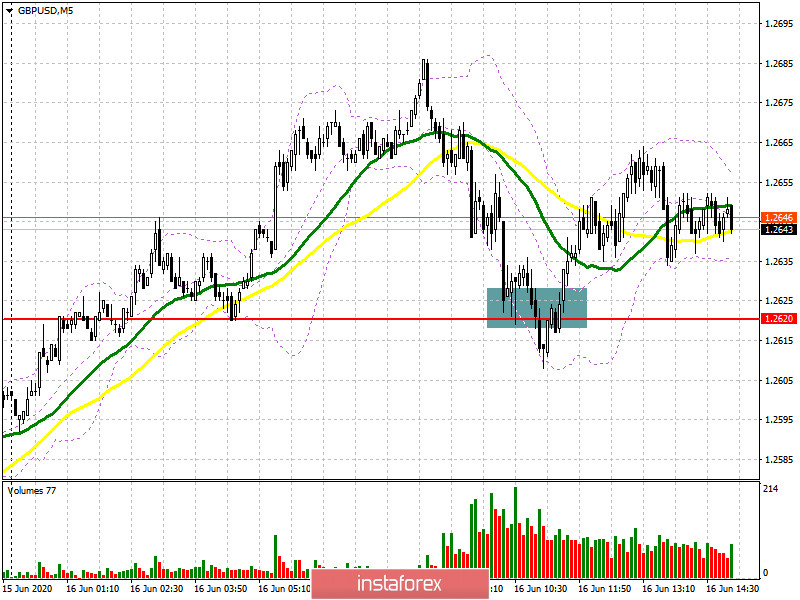
In my morning forecast, I paid attention to purchases after forming a false breakout in the support area of 1.2620, which happened. Buyers of the pound were slightly more fortunate than buyers of the euro. If you look at the 5-minute chart, you will see how the bears are trying to push the pair below the level of 1.2620, however, the bulls quickly return it back to this level, forming a good buy signal. Now their task remains to update the new local maximum of 1.2714, where I recommend fixing the profits. The longer-term goal will be the area of 1.2803, the test of which will indicate the resumption of the bullish trend for the pound. Many buyers expect more constructive negotiations on a trade agreement, as described in more detail in this review. If the bears manage to pick up the support level of 1.2620, it is best to look at long positions only after updating the major support level in the area of 1.2536 or buy GBP/USD immediately on the rebound from the minimum of 1.2453.
To open short positions on GBPUSD, you need:
Sellers of the pound still have problems with maintaining bearish momentum. Only another test of the support of 1.2620 and fixing below this level will be a signal to open short positions in GBP/USD, which will lead to a new decline in the pair and update the minimum of 1.2536, just above which the moving averages pass. The longer-term goal of the bears is to update the area of 1.2453, where I recommend fixing the profits. If the demand for the pound persists in the second half of the day, I do not recommend rushing to open short positions from the resistance of 1.2714. It is best to wait for the formation of a false breakout there. You can sell immediately for a rebound from a larger weekly high of 1.2803, based on a correction within the day of 30-40 points.
Signals of indicators:
Moving averages
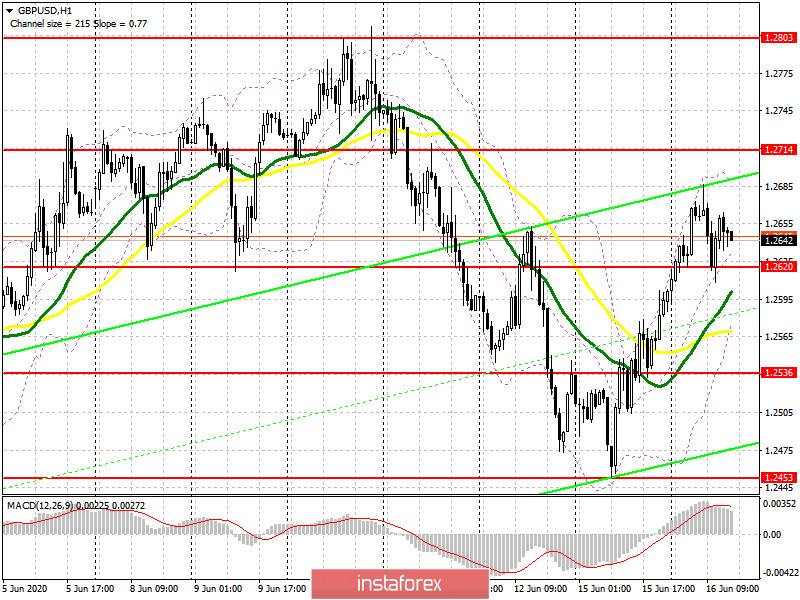
Trading is conducted above the 30 and 50 daily averages, which indicates the continuation of bullish sentiment in the market.
Note: The period and prices of moving averages are considered by the author on the hourly chart H1 and differ from the general definition of the classic daily moving averages on the daily chart D1.
Bollinger Bands
A break of the upper border of the indicator in the area of 1.2690 may lead to a new wave of growth of the British pound. Pressure on the pound will be contained by the lower border of the indicator in the area of 1.2570.
Description of indicators
- Moving average (moving average determines the current trend by smoothing out volatility and noise). Period 50. The graph is marked in yellow.
- Moving average (moving average determines the current trend by smoothing out volatility and noise). Period 30. The graph is marked in green.
- MACD indicator (Moving Average Convergence / Divergence - moving average convergence / divergence) Fast EMA period 12. Slow EMA period 26. SMA period 9
- Bollinger Bands (Bollinger Bands). Period 20


