


Hello, traders!
In yesterday's trading, the US dollar strengthened across a wide range of markets. Renewed demand for American products was caused by new spikes in COVID-19 infections in several US states, as well as Donald Trump's intention to raise tariffs on goods from leading European countries.
Although yesterday's IFO indices for Germany all came out in the green zone, this did not support the single European currency. Looking at today's economic calendar, you should pay attention to the macroeconomic reports from the United States of America. At 13:30 London time, a whole block of statistical data will be released from the US, namely: final GDP data for the first quarter, initial applications for unemployment benefits, price deflator, and data on orders for durable goods.
Daily
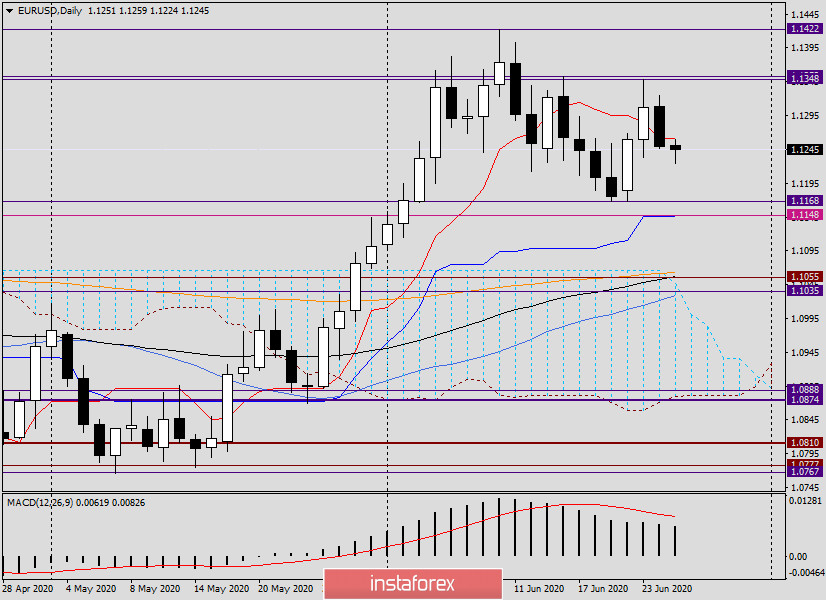
As can be seen on the daily chart of the main currency pair of the Forex market, the price failed to gain a foothold above the Tenkan line of the Ichimoku indicator, as well as above the strong and significant level of 1.1300. Wednesday's trading ended at 1.1250, and at the moment of writing this article, the pair continues to decline, trading near 1.1233. If the downward trend continues, the euro/dollar may fall to the support area of 1.168-1.146. In my opinion, this is the most important stronghold for euro bulls. If the designated price zone is broken and the rate is fixed at 1.1146, where the Kijun line runs, the subsequent downward scenario will have all the chances to continue. In this case, the pair risks falling to the area of 1.1060, where the 200 and 89 exponential moving averages are located, as well as the upper border of the Ichimoku indicator cloud passes.
For the bulls to regain control of the pair, it is necessary to break through strong resistance from sellers in the area of 1.1350, and then test for a break at the level of 1.1422, where the trading highs were shown on June 10. I believe that these are extremely difficult tasks for players to upgrade the course. The greatest prospects for continuing the downward trend: the market sentiment and the technical picture on the daily chart.
H4
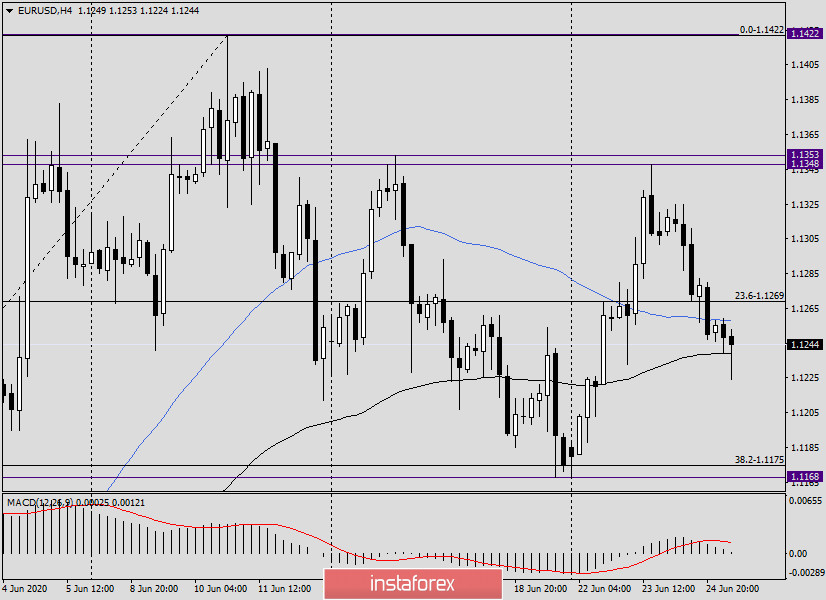
On this timeframe, at the moment of writing, the pair breaks through the 89 exponential moving average. If the breakout takes place, then on the pullback to the 89 EMA, you can try to sell the euro/dollar pair with a goal near 1.1170. In case of the inability of bears to push the euro/dollar through the 89 EMA and the appearance of reversal bullish candles (or candles) over this moving, it is already worth considering purchases with goals in the area of 1.1280-1.1300. So far, everything on this chart indicates that after reaching the level of 1.1348 and the appearance of a reversal bearish candle there, the most urgent at the moment is the movement in the south direction, to the area of 1.168-1.148.
H1
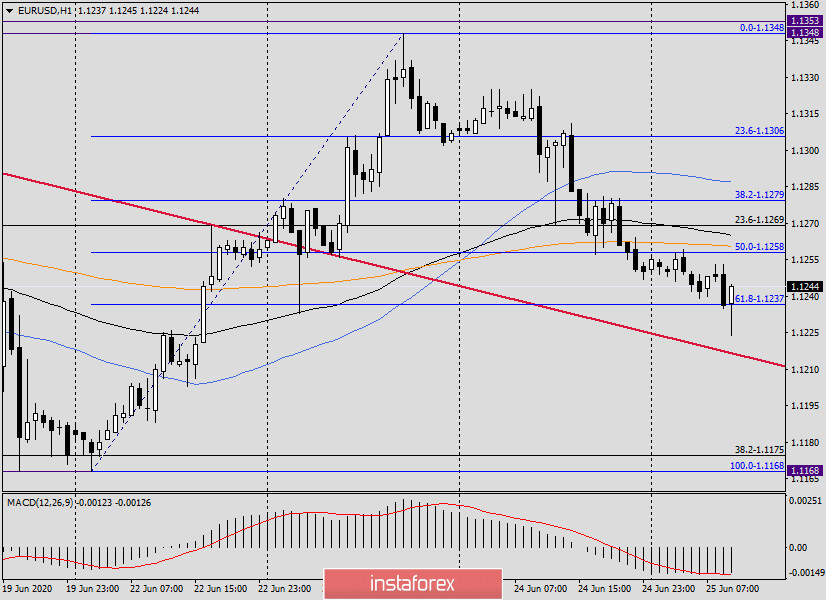
However, on the hourly chart, the picture looks somewhat different. At the end of this article, a reversal bullish candle with a long lower shadow is formed. Judging by the current picture on this timeframe, the pair is turning up, where the nearest targets of probable growth will be 1.1260 (200 EMA), 1.1265 (89 EMA) and 1.1287 (50 MA). The appearance of reversal patterns of candle analysis near the listed levels will give a signal to open sales. If the pair breaks 1.1287 (50 MA), most likely, the price will continue to rise in the price area of 1.1300-1.1325, where it is again worth looking for signals for selling the single European currency.


