


Ideas for opening long deals on EUR/USD
In the first half of the trading day, I spoke about buy deals amid the correction and a fake breakout at near the support level of 1.1236. Looking at the 5-minute chart, you see that the bulls barred the euro a few pips away from that level. So, the bulls are pushing hard to encourage a further growth of EUR/USD. As a result, the pair tested resistance at 1.1280. This crucial level will determine a further price trajectory. Another market-moving event is inflation data from Germany which will be published in the second half of the trading day. Solid data will enable a breakout of 1.1280. This will be a new sign to open long positons aiming to test a swing high of 1.1321 where I recommend profit taking. Importantly, don't forget to see the price consolidation at that level which will open the door to long deals. Alternatively, if the bears manage to keep resistance of 1.1280 under control, it would be better to delay long deals on EUR/USD until the price reaches a lower low of 1.1236. Another option is to buy EUR immediately during a bounce from Friday's support of 1.1198. 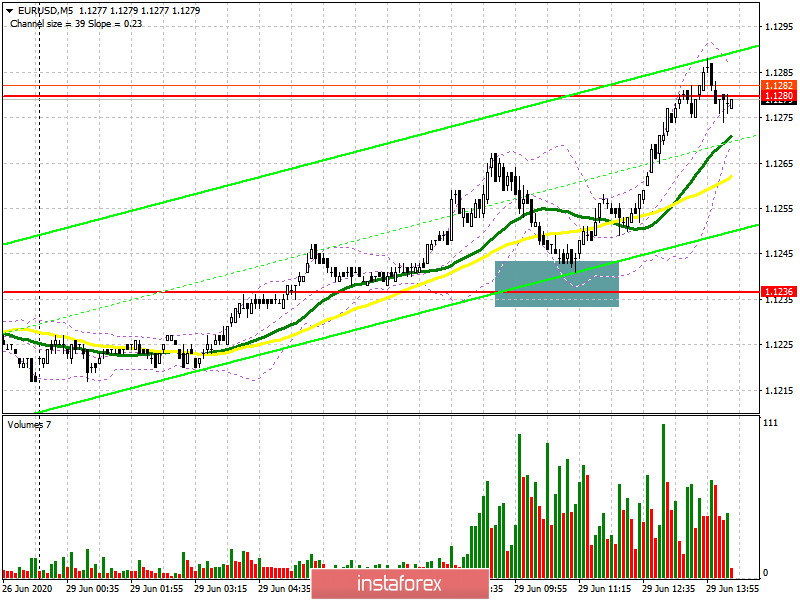
Ideas for opening short deals on EUR/USD
Meanwhile, sellers are unwilling to assert themselves. This could extend an upward correction of EUR/USD the same way like at the start of the last week. In case inflation data from Germany is worse than expected, I would project a fake breakout at 1.1280 and a further downward move towards the earlier support at 1.1198. If EUR's growth continues later in the global day, short positions would be logical when the price is rejected from the key resistance of 1.1321 bearing in mind a 20-25-point correction in the late session.
Indicators' signals
Moving averages
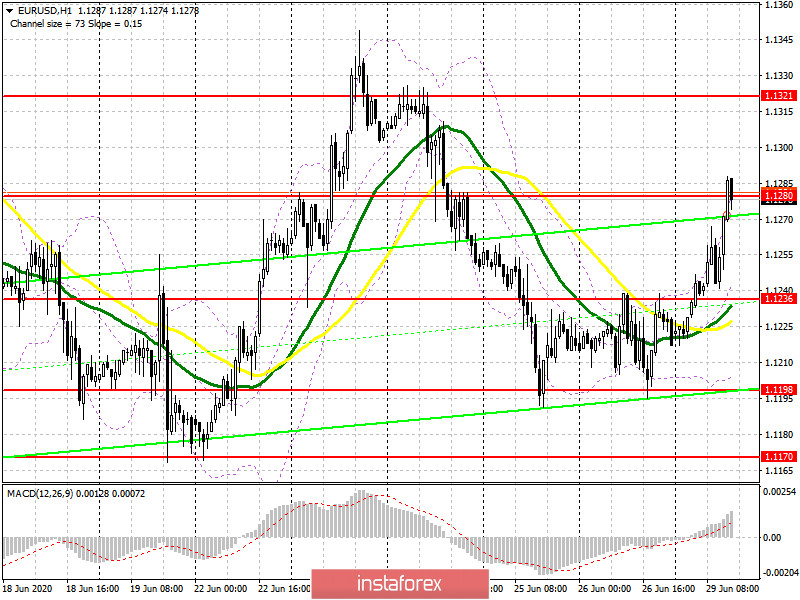
The pair is trading above 30- and 50-period moving averages. This signals a further EUR's growth in the short term.
Remark. The author is analyzing a period and prices of moving averages on the 1-hour chart. So, it differs from the common definition of classic daily moving averages on the daily chart.
Bollinger Bands
In case of a downward move, the pair will find support at the middle line of Bollinger Bands at 1.1236. It would be a good idea to buy the pair immediately at a bounce when the lower border of 1.1205 is tested.
Definitions of technical indicators
- Moving average recognizes an ongoing trend through leveling out volatility and market noise. A 50-period moving average is plotted yellow on the chart.
- Moving average identifies an ongoing trend through leveling out volatility and market noise. A 30-period moving average is displayed as the green line.
- MACD indicator represents a relationship between two moving averages that is a ratio of Moving Average Convergence/Divergence. The MACD is calculated by subtracting the 26-period Exponential Moving Average (EMA) from the 12-period EMA. A 9-day EMA of the MACD called the "signal line".
- Bollinger Bands is a momentum indicator. The upper and lower bands are typically 2 standard deviations +/- from a 20-day simple moving average.


