


To open long positions on GBPUSD, you need:
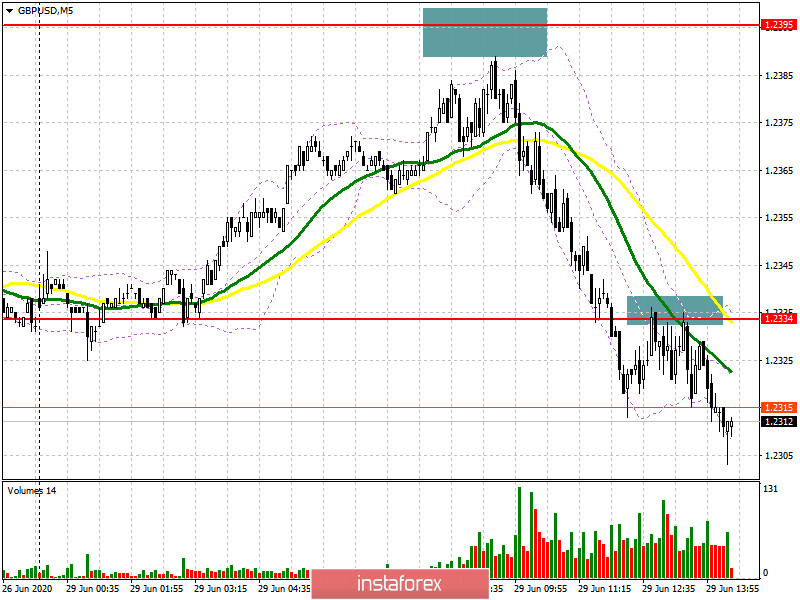
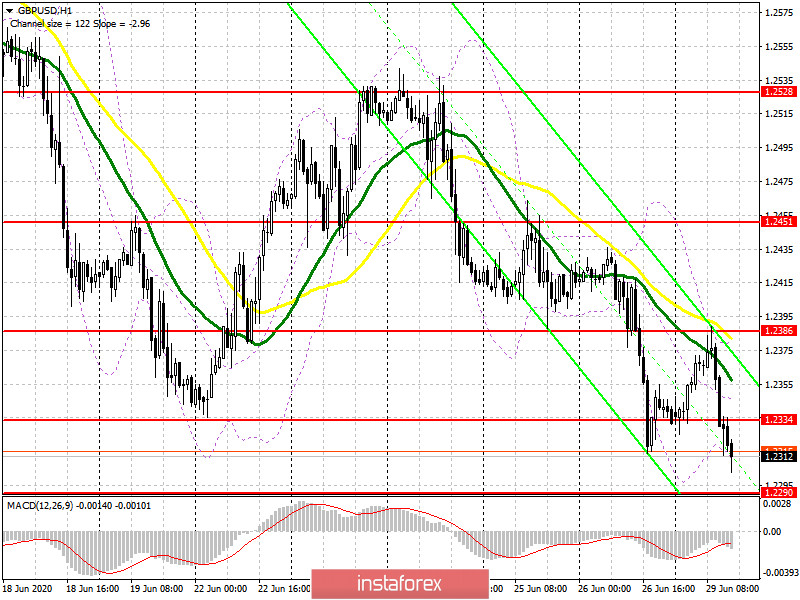
Buyers failed to take advantage of the Asian upward momentum and retreated from the market after a sluggish attempt to update the resistance of 1.2395, which I drew attention to in my morning forecast. If you look at the 5-minute chart, you will see how the bulls tried to test the level of 1.2395, but nothing came of it, after which the pound quickly went down. Unfortunately, it was not possible to wait for a good entry point from this level, which can not be said about the support of 1.2334. Immediately from the first time, the bears broke below this range and gained a foothold under it, making a fairly successful test from the bottom up, which was a signal to open short positions. The key task of the bulls in the second half of the day will be to return to the level of 1.2334, since only then can we expect a repeated growth of the pound to the area of 1.2385, where I recommend fixing the profits. It will be possible to talk about the formation of a larger upward correction and the end of the bearish trend only after the breakout of the level of 1.2385 and the update of the maximum of 1.2451. In the scenario of a further decline in GBP/USD, and while everything is going to this, it is best to consider long positions from the level of 1.2290 only after the formation of a false breakout there, but I recommend buying the pound immediately for a rebound from the minimum of 1.2237 in the calculation of correction of 30-40 points within the day.
To open short positions on GBPUSD, you need:
The bears achieved their goal and broke below the level of 1.2334, forming a good sell signal there. While trading will be conducted below this range, you can expect to continue reducing the GBP/USD to the support area of 1.2290, where the first attempt to fix profits will occur, but more persistent sellers will expect to update the minimum of 1.2237, from which I recommend completely leaving the market. An equally important task for the bears will be to protect the resistance of 1.2334. Opening new short positions from this level, in case of returning to it in the afternoon, is possible only after the formation of a false breakdown. I recommend selling GBP/USD immediately for a rebound only after testing the morning high of 1.2386, counting on correction of 30-35 points within the day.
Signals of indicators:
Moving averages
Trading is conducted below the 30 and 50 daily averages, which act as a resistance for buyers.
Note: The period and prices of moving averages are considered by the author on the hourly chart H1 and differ from the general definition of the classic daily moving averages on the daily chart D1.
Bollinger Bands
A break in the lower border of the indicator at 1.2310 should increase the pressure on the British pound. If there is no rapid downward movement, it is best to abandon sales at the lows.
Description of indicators
- Moving average (moving average determines the current trend by smoothing out volatility and noise). Period 50. The graph is marked in yellow.
- Moving average (moving average determines the current trend by smoothing out volatility and noise). Period 30. The graph is marked in green.
- MACD indicator (Moving Average Convergence / Divergence - moving average convergence / divergence) Fast EMA period 12. Slow EMA period 26. SMA period 9
- Bollinger Bands (Bollinger Bands). Period 20


