Crypto Industry News:
Savvy Bitcoin "hodlers" hardly spent any coins despite a record $ 69,000 this year, data show. According to the Coin Days Destroyed (CDD) index by network analysis company Glassnode, the percentage of coins sold by seasoned owners remains close to an all-time low.
The indicator relates to how long each BTC that is moving has been dormant. This provides an alternative to simple volume measurements to identify market trends. Older coins are therefore more "important" than younger coins with a history of active movement. The data highlights that from the spike in old coin sales after BTC/USD broke its 2017 highs of $20,000 last year, savvy owners have been keeping their coins. Even the run to nearly $70,000 hasn't been able to break the trend significantly, and sales still seem to come from newer players in the market.
Technical Market Outlook
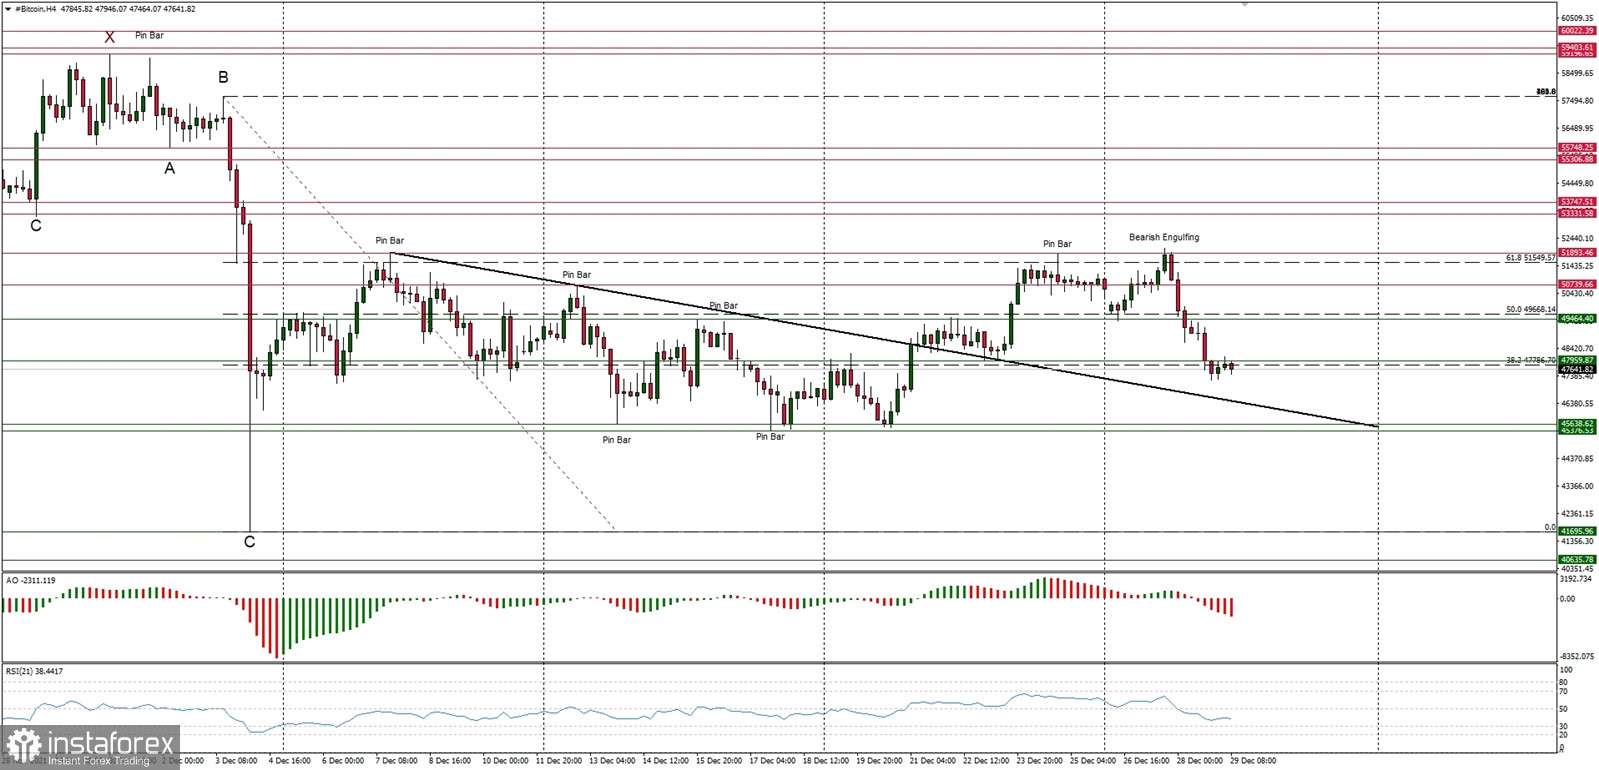
The BTC/USD pair had been rejected from the technical resistance seen at the level of $51,893 again and after the Bearish Engulfing candlestick pattern was made, the sell of had started. Currently the market is trading below the technical support seen at the level of $47,595 and is heading towards the old trend line support. The key short-term technical resistance is located at the level of $51,913 (Pin Bar high) and $53,333. Despite the recent complex and time consuming corrective decline in form of ABCxABCxABC pattern, the larger time frame trend remains up and only a clear and sustained breakout below the wave C low at $41,678 would change the outlook to bearish again.
Weekly Pivot Points:
WR3 - $60,286
WR2 - $56,809
WR1 - $53,868
Weekly Pivot - $49,723
WS1 - $47,540
WS2 - $43,220
WS3 - $41,111
Trading Outlook:
The ABCxABCxABC complex corrective cycle might be terminated at the level of $41,678 and the market is ready to continue the up trend. According to the long-term charts the bulls are still in control of the Bitcoin market and the next long term target for Bitcoin is seen at the level of $70,000. This scenario is valid as long as the level of $39,474 is clearly broken on the daily time frame chart (daily candle close below $39,000 would be considered as a long-term trend change due to the lower low placement).