Good day, dear traders!
An interesting currency pair AUD/USD has not been considered for a long time. Today, on the day of the end of weekly trading, we will fill this gap. I would like to draw your attention to the fact that this forecast is not designed exclusively for today. So, let's go.
This week, important macroeconomic data were released from Australia, for example, on the labor market. According to statistics, the unemployment rate coincided with forecasts and amounted to 7.4%, which is slightly higher than the previous indicator of 7.1%. At the same time, the number of employees increased significantly and exceeded the experts' expectations, which were reduced to 112.5. In fact, the indicator is higher at the level of 210.8. As you know, the difference is significant.
Since this review is mainly technical in nature, we will immediately proceed to the analysis of the charts of the AUD/USD currency pair.
Weekly

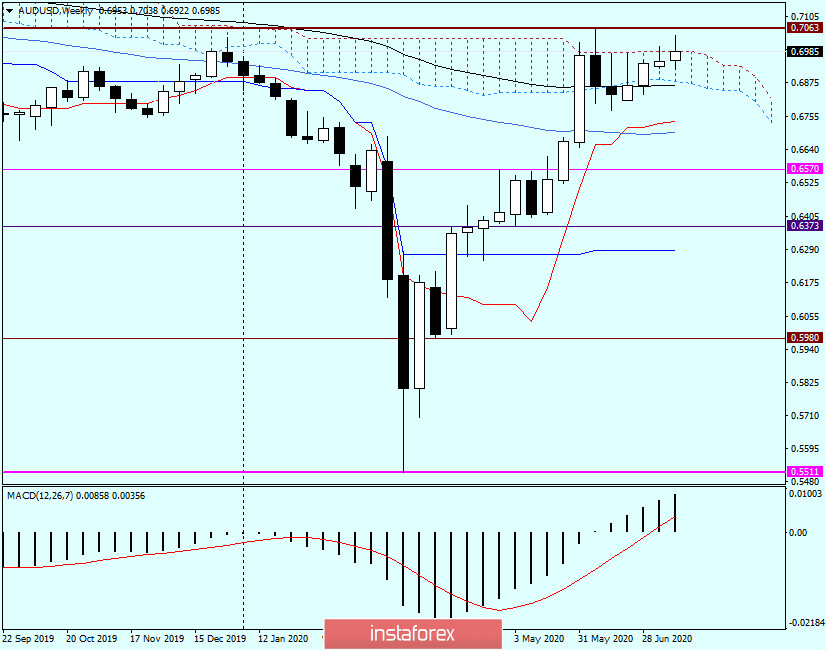
As you can see, on the weekly timeframe, the pair is stuck within a fairly modest cloud size of the Ichimoku indicator and can not leave it in any way. At the same time, a possible exit downwards is insured by the 89 exponential moving average, which passes at the level of 0.6866, that is, directly below the lower border of the cloud. This means additional support in case of pressure on the quote.
Strong resistance from sellers passes near the strong technical level of 0.7060, or to be more precise, at 0.7063. At the same time, do not forget about the iconic psychological level of 0.7000, around which the "Australian" circles. I would like to note that the weekly closing price above 0.7000, despite numerous attempts, has not yet been reached. If the Aussie bulls fail to overcome the mark of 0.7000, it is possible that the reins of the aud/usd will fall into the hands of bears and the pair will begin to decline. We are waiting for the results and closing price of the current week. The chances of success remain with both sides.
Daily

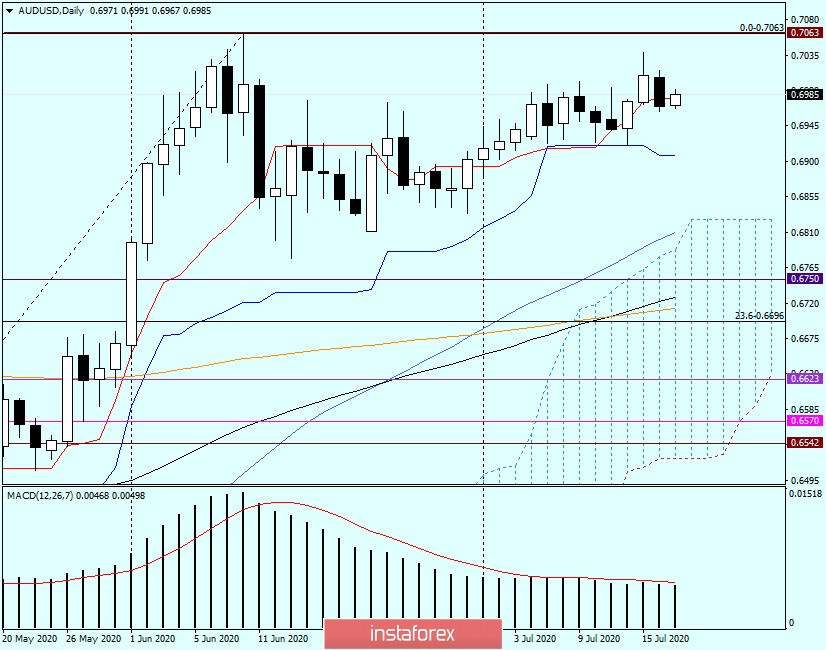
The daily chart is also uncertain. If the day before yesterday trading ended above the Tenkan line (red), yesterday the pair ended the session with a decline and closed the day under Tenkan. At the time of writing, the Australian dollar is strengthening against the US dollar. If this trend continues, the nearest bull targets for AUD/USD will be the levels of 0.7000, 0.7038 (highs on July 15) and the most important resistance of sellers at 0.7063.
If the market chooses a downward scenario, the pair risks falling into the price zone of 0.6922-0.6907, where the minimum trading values are on July 14, as well as the Kijun line of the Ichimoku indicator.
Trading recommendations for AUD/USD:
Given the uncertain nature of trading for this currency pair at the moment, both purchases and sales remain relevant.
I recommend that you take a closer look at the opening of long positions on the "Aussie" after a short-term decline to the price zone of 0.6970-0.6950. The typical patterns of Japanese candlesticks will be a confirmation signal for opening buy deals.
Sales will become relevant after the appearance of bearish candle patterns in the price area of 0.7000-0.7060 on the same or daily timeframes. In my personal opinion, the ascending scenario has more chances, but the bulls for this instrument need a driver to break through strong resistance in the area of 0.7063 and consolidate above this mark.
Have a nice weekend!


