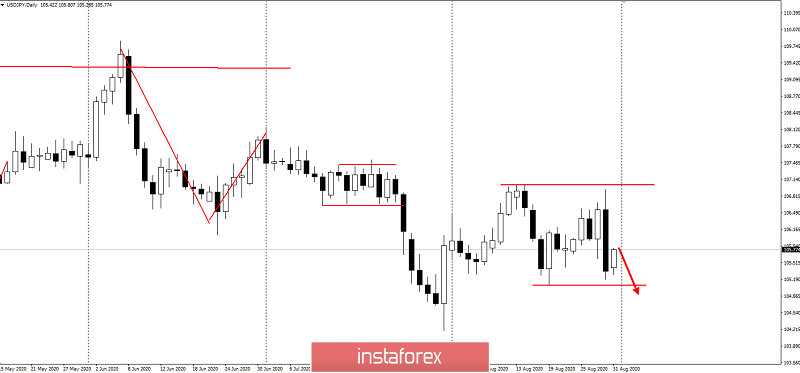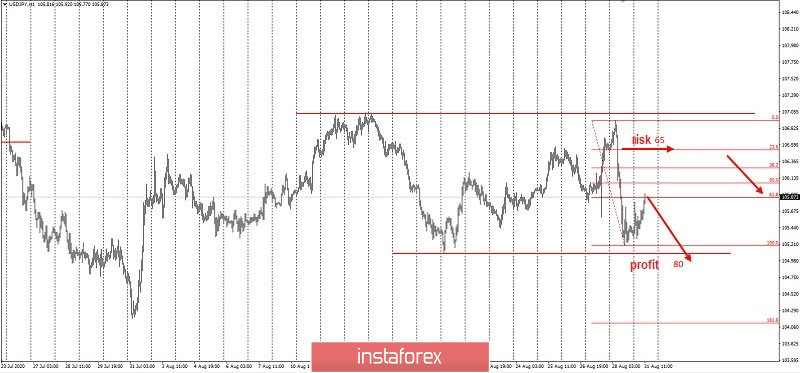
An absorption has formed on the daily chart last Friday, due to which price pulled back 6.18% Fibonacci, which made short positions profitable in the market.
Daily chart (D1 TF):

Hourly chart (H1 TF):

In fact, the impulse created an Elliot Wave in the price chart, which may be completed with short positions set from price level 105.10 to price level 106.5.
Such follows the strategy of classic Price Action and Stop Hunting methods, and has a profitability of 1: 1.
Of course, controlling the risks is needed in order to avoid losing profit. Thus, best of luck and have a nice day!


