


The pair continued to decline on Monday testing the historical support level 1.2919 (white dashed line). Today, the downward movement may continue. Based on the economic calendar, pound news is expected at 07:30 UTC, and dollar news is expected at 14:00 and 14:30 UTC.
Trend analysis (Fig. 1).
The market may continue to move downward from the level of 1.2818 (closing of yesterday's daily candlestick) with the target of 1.2721 - a 61.8% pullback level (red dotted line). In case of reaching this level, the downward trend may continue with the next target at the historical support level 1.2646 (blue dotted line).
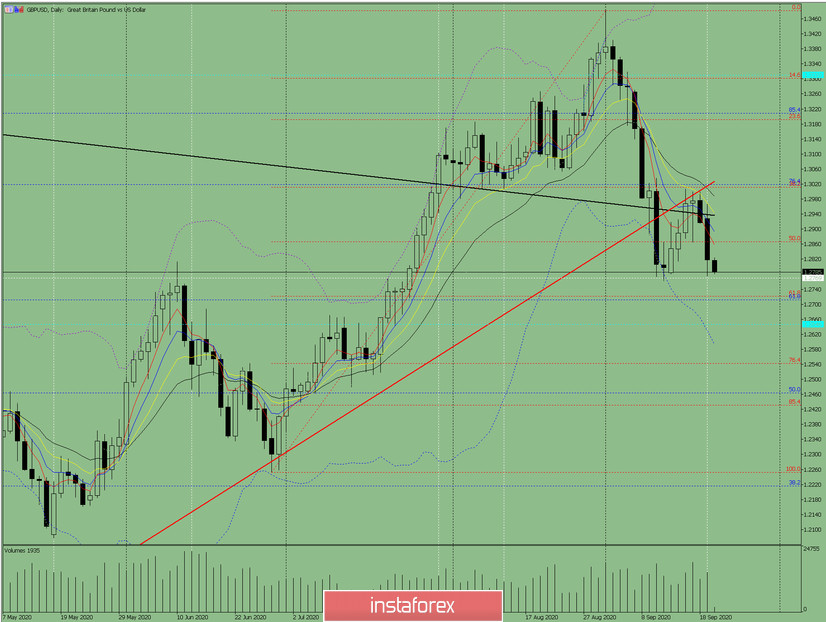
Figure: 1 (daily chart).
Comprehensive analysis:
- Indicator analysis - down;
- Fibonacci levels - down;
- Volumes - down;
- Candlestick analysis - down;
- Trend analysis - down;
- Bollinger lines - down;
- Weekly chart - down.
General conclusion:
Today, the price may continue to move downward from the level of 1.2818 (closing of yesterday's daily candlestick) with the target of 1.2721 - a 61.8% pullback level (red dotted line). In case of reaching this level, the downward trend may continue with the next target at the historical support level 1.2646 (blue dotted line).
Another possible scenario is a downward movement with the target at the historical support level 1.2769 (white dashed line). In case of reaching this level, the price may begin to move upward with the target of 1.3019 - a 76.4% pullback level (blue dotted line).


