


Trend analysis.
This week, the price from the level of 1.1630 (close of the last weekly candle) may start rising towards the goal of 1.1670 - the pullback level of 14.6% (red dotted line). If this level is tested, we can continue to work upward with the goal of 1.1705 - the pullback level of 23.6% (red dotted line).
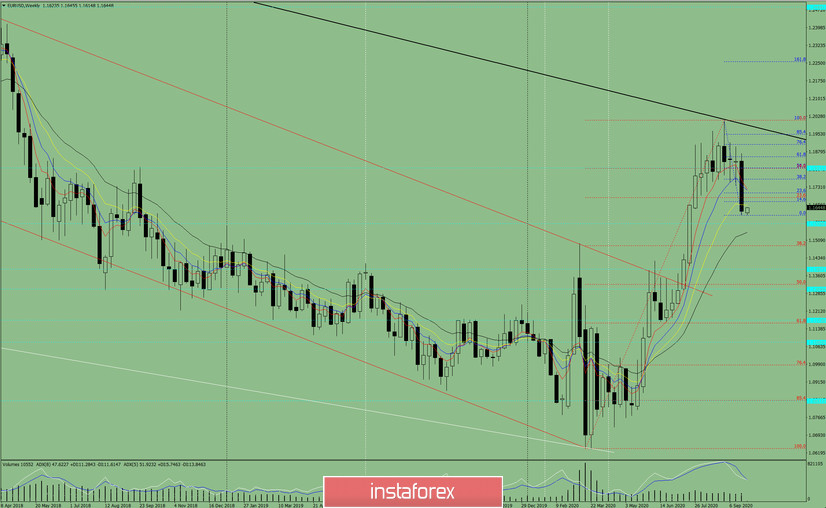
Figure: 1 (weekly chart).
Comprehensive analysis:
- indicator analysis - up;
- Fibonacci levels - up;
- volumes - up;
- candlestick analysis - up;
- trend analysis - down;
- Bollinger lines - up;
- monthly chart - up.
An upward movement can be concluded based on comprehensive analysis.
The general result of the calculation of the candlestick of the EUR/USD pair according to the weekly chart: this week's price is likely to have an upward trend, without a lower shadow in the weekly white candlestick (Monday - up), but with an upper shadow (Friday - down).
The first upper target is at 1.1670 - a pullback level of 14.6% (red dashed line). If this level is tested, we can continue to work upward with the target of 1.1705 - the pullback level of 23.6% (red dotted line).
An unlikely scenario: when moving up and reaching the pullback level of 14.6% (red dashed line), it is unlikely that price may start declining, with the target at 1.1486 - a pullback level 38.2% (blue dashed line).


