


Trend analysis.
This week, the price is expected to increase from the level of 1.2743 (closing of the last weekly candlestick) in order to reach the pullback level of 38.2% - 1.2980 (blue dotted line). If this line is broken upwards, we can continue to further rise with the goal of the 50.0% pullback level - 1.3076 (blue dashed line).
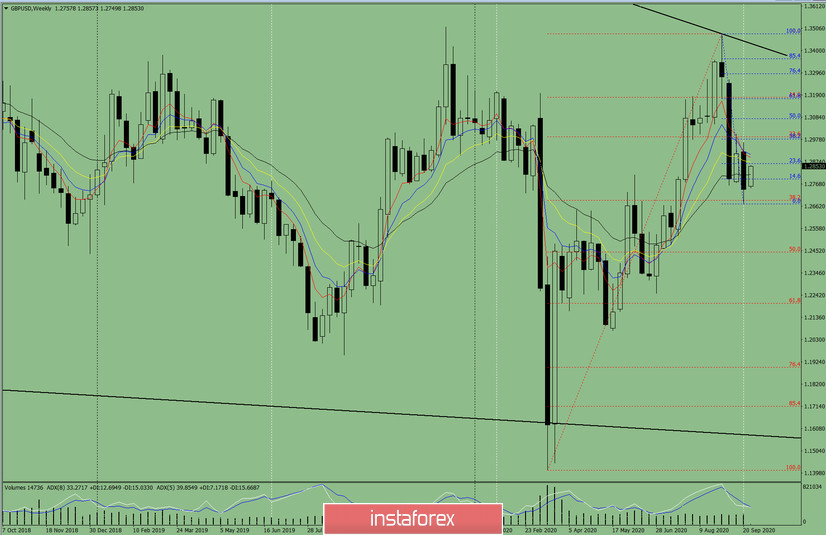
Figure: 1 (weekly chart).
Comprehensive analysis:
- indicator analysis - up;
- Fibonacci levels - up;
- volumes - up;
- candlestick analysis - up;
- trend analysis - up;
- Bollinger lines - up;
- monthly chart - up.
An upward movement can be concluded based on a comprehensive analysis.
The general result of calculating the candlestick of the GBP/USD pair according to the weekly chart: the price is likely to have an upward trend this week without the first lower shadow of the weekly white candlestick (Monday - up) and with the second upper shadow (Friday - down).
The first upper target is a pullback level of 23.6% - 1.2862 (blue dashed line). In case of breaking this line up, we can continue to further rise towards the target of the pullback level of 38.2% - 1.2980 (blue dotted line).
An unlikely scenario: when moving up and testing the pullback level of 23.6% - 1.2862 (blue dotted line), it is unlikely that the price will decline, with the goal of the lower fractal - 1.2673 (blue dotted line).


