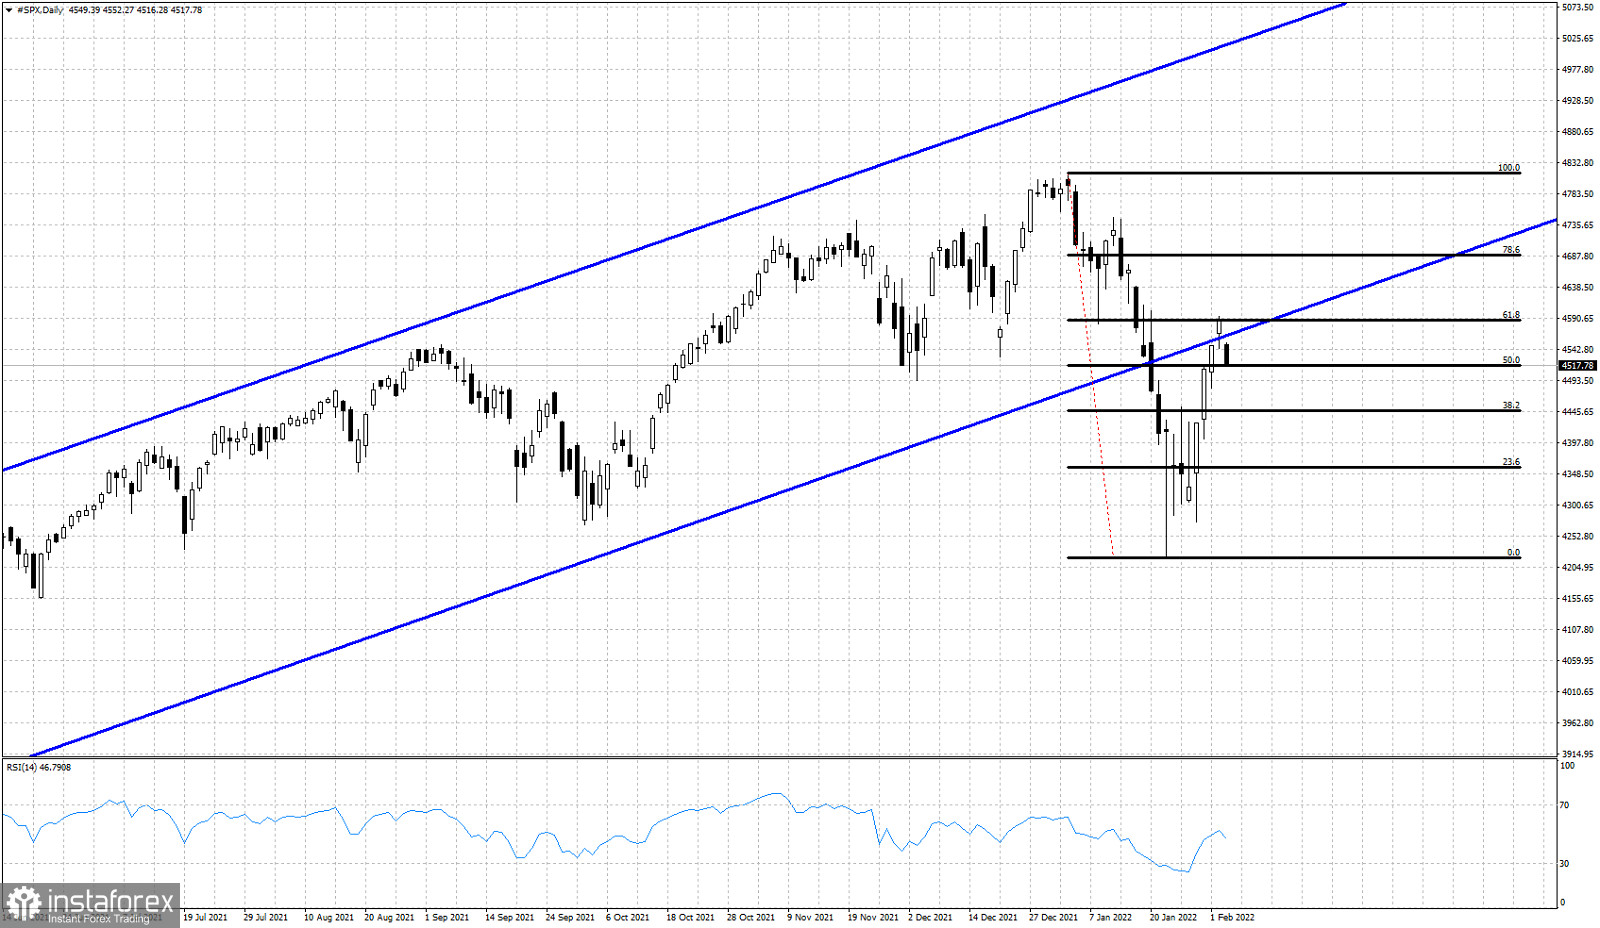
SPX broke out of the bullish channel it was trading and lost nearly 600 points in less than a month. In previous posts we warned that there were signs of an imminent reversal as the up trend was weakening. The index made a low at 4220 and has since then bounced strongly higher.

Black lines -Fibonacci retracement
SPX has reached the 61.8% Fibonacci retracement of the decline. At the same time price is back testing the lower channel boundary from below. Today price is in negative territory showing us rejection signals. A reversal from the current levels is a bearish sign but also a confirmation that the resistance at 4600 is very important. SPX getting rejected at the back test could lead to another leg lower. Bulls need to be very cautious.


