


Trend analysis (Fig. 1).
Today, the market may roll back down from the level of 1.3148 (closing of yesterday's daily candle) with the target of 1.3104 - the retracement level of 14.6% (red dotted line). Upon reaching this level, the continuation of work downward with the target of 1.3058 - the retracement level of 23.6% (red dotted line).
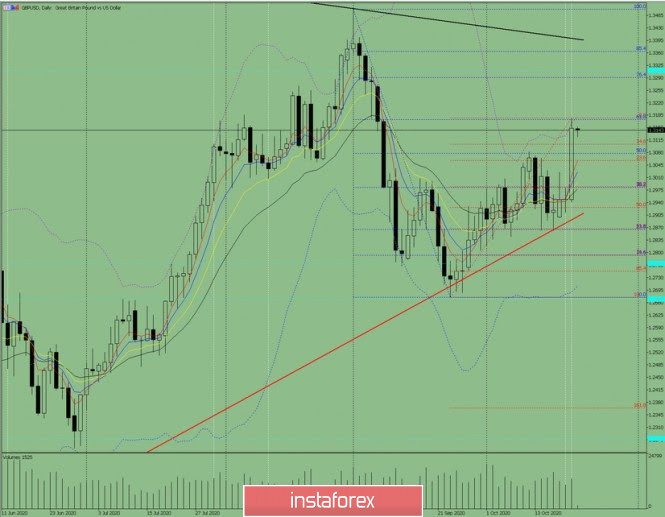
Figure: 1 (daily chart).
Comprehensive Analysis:
- Indicator Analysis - down
- Fibonacci Levels - down
- Volumes - down
- Candlestick Analysis - down
- Trend Analysis - up
- Bollinger Lines - down
- Weekly Chart - down
General conclusion:
Today the price will try to move down with the target of 1.3104 - the retracement level of 14.6% (red dotted line). Upon reaching this level, the continuation of work downward with the target of 1.3058 - the retracement level of 23.6% (red dotted line).
Alternative scenario: the market will try to move down from the level of 1.3148 (closing of yesterday's daily candle) with the target at 1.3104 - the retracement level of 14.6% (red dotted line) and go up from this level with the target at 1.3177 upper fractal (red dotted line).


