


Trend analysis (Fig. 1)
Today, the market, from the level of 1.3084 (closing of yesterday's daily candle), will try to continue moving down with the goal of 1.2985 which is a pullback level of 38.2% (red dotted line). When this level is reached, the price can start moving up with the next target of 1.3078 which is the pullback level of 50.0% (blue dotted line). When testing this level, further work up with the target 1.3177 upper fractal (red dotted line).
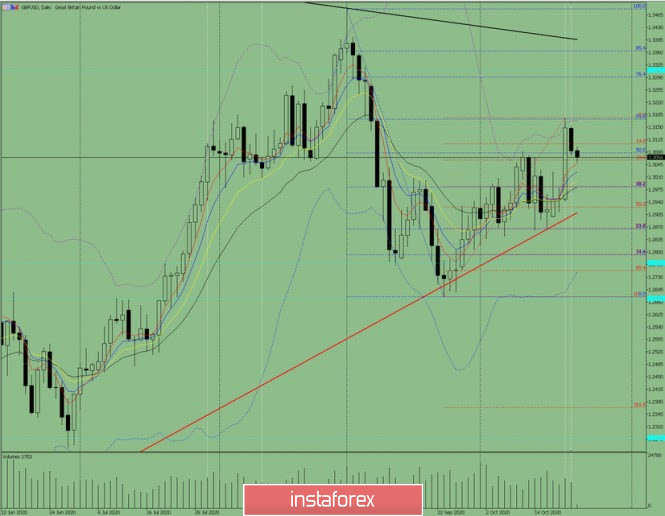
Figure 1 (daily chart).
Complex Analysis
- Indicator Analysis - down
- Fibonacci Levels – down
- Volumes – down
- Technical Analysis – down
- Trend analysis-up
- Bollinger Bands – down
- Weekly Chart - up
General conclusion:
Today, the price from the level of 1.3084 (the closing of yesterday's daily candle) will try to continue moving down with the goal of 1.2985 which is a pullback level of 38.2% (red dotted line). When this level is reached, the price can start moving up with the next target of 1.3078-the pullback level of 50.0% (blue dotted line).
Alternative scenario: when moving down to the retracement level of 38.2% - 1.2985 (red dotted line), the continuation of the downward movement to the next target will be 1.2926 which is the retracement level of 50.0% (red dotted line).


