


Trend analysis (Fig. 1)
Today, the market may start moving down from the level of 1.1860 (closing of Friday's daily candlestick) in order to reach the pullback level of 23.6% - 1.1817 (red dotted line). If this line is tested, there is a possibility that the downward movement will resume with the target of 1.1786-21 average EMA (black thin line).
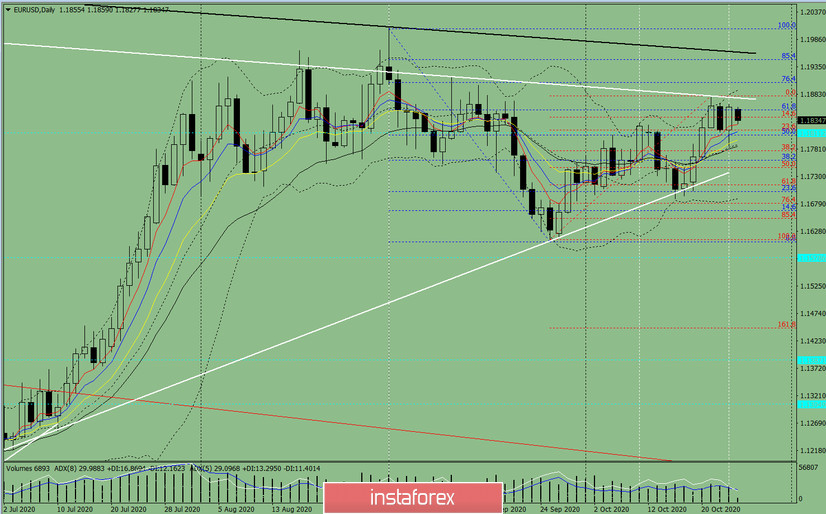
Figure 1 (daily chart).
Comprehensive analysis:
- Indicator analysis - down
- Fibonacci levels - down
- Volumes - down
- Technical analysis - down
- Trend analysis - down
- Bollinger bands - up
- Weekly chart - down
General conclusion:
Today, the price might make a downward movement in order to reach the pullback level of 23.6% - 1.1817 (red dotted line). If this line is tested, it is possible for the downward movement to continue with the target of 1.1786-21 average EMA (black thin line).
Unlikely scenario: from the level of 1.1860 (closing of the Friday day candle) - work down with the target of 1.1817, which is a pullback level of 23.6% (red dotted line). Upon testing this level, work up with the goal of 1.1880 upper fractal (red dotted line), from which the upper work is possible.


