


Trend analysis (Fig. 1).
Today, the market may continue to go down from the level of 1.3044 (closing of the Friday's daily candle) with the target of 1.2985 - the retracement level of 38.2% (red dotted line). When testing this level, it is possible that the work will continue going down with the target of 1.2926 - the retracement level of 50.0% (red dashed line).
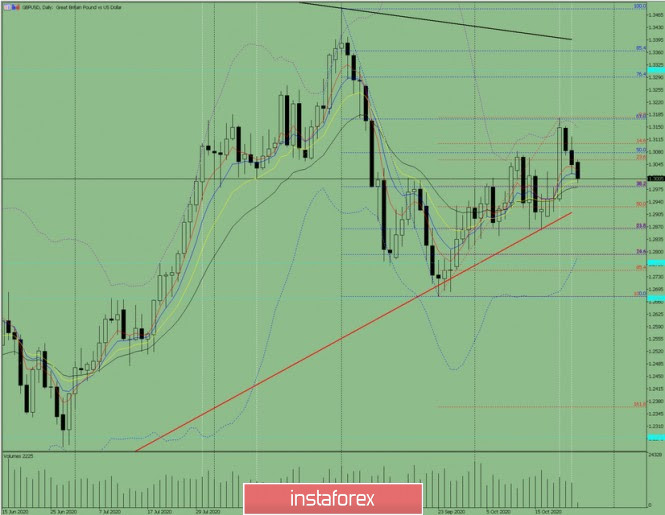
Figure: 1 (daily chart).
Comprehensive Analysis:
- Indicator Analysis - down
- Fibonacci levels - down
- Volumes - down
- Candlestick Analysis - down
- Trend Analysis - down
- Bollinger Lines - up
- Weekly Chart - down
General conclusion:
Today, the price will try to continue going down with the target at 1.2985 - the 38.2% retracement level (red dotted line). When testing this level, it is possible that the work will continue downwards with the target at 1.2926 - the retracement level of 50.0% (red dashed line).
Unlikely scenario: from the level of 1.3044 (closing of the Friday's daily candlestick) the price may continue to move downward with the target at 1.2983 - the retracement level of 38.2% (blue dotted line). When testing this level, further work will go up with the target of 1.3078 - the retracement level of 50% (blue dashed line).


