


Trend analysis (Fig. 1).
Today, the market may start working down from the level of 1.2991 (closing of yesterday's daily candle) with the target of 1.2950 - the support line (red bold line). After testing this line, the upper work with the goal of 1.3016 - the pullback level of 50.0% (blue dotted line). When this level is reached, it will continue to go up with the goal of 1.3054 – a rollback level of 61.8% (blue dotted line).
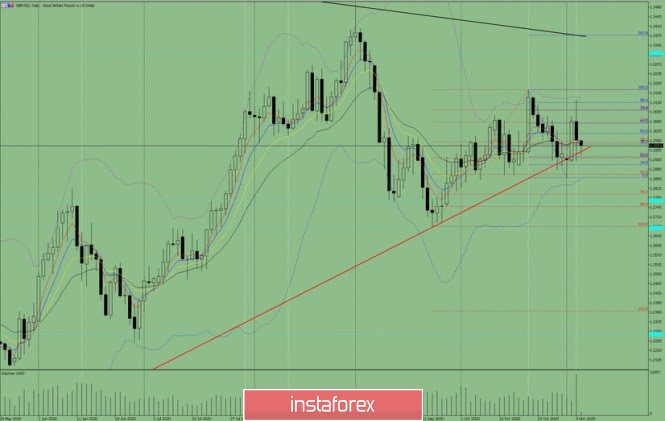
Figure 1 (daily chart).
Complex Analysis:
- Indicator Analysis - up
- Fibonacci Levels - up
- Volumes - up
- Candle Analysis - up
- Trend Analysis - up
- Bollinger Bands - up
- Weekly Chart - down
General Conclusion:
Today, the price from the support line 1.2950 (red bold line) will try to move up with the goal of 1.3016 – a pullback level of 50.0% (blue dotted line). When this level is reached, it will continue to go up with the goal of 1.3054 – a rollback level of 61.8% (blue dotted line).
Unlikely scenario: when the market moves up and reaches the pullback level of 50% - 1.3016 (blue dotted line), it will try to move down with the target of 1.2926 - pullback level of 50.0% (red dotted line) and go down from this level with the target of 1.2867- pullback level of 61.8% (red dotted line).


