


Trend analysis (Fig. 1).
Today, the market will try to continue moving up from the level of 1.3351 (the closing of yesterday's daily candle) with the goal of 1.3393 which is the historical resistance level (blue dotted line). When this line is reached, the price can continue to move up with the goal of 1.3436 which is the target level of 161.8% (blue dotted line).
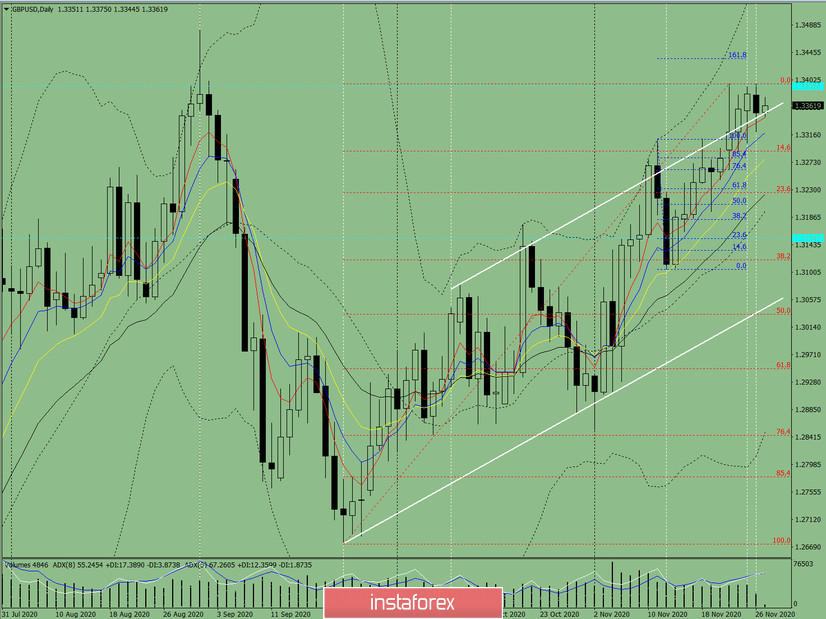
Figure 1 (daily chart)
Complex analysis:
- Indicator Analysis – up
- Fibonacci Levels – up
- Volumes – up
- Candle Analysis – up
- Trend Analysis – up
- Bollinger Bands – up
- Weekly Chart – up
General conclusion:
Today, from the level of 1.3351 (closing of yesterday's daily candle), the price will try to continue moving up with the goal of 1.3393 which is the historical resistance level (blue dotted line). When this line is reached, the price can continue to move up with the goal of 1.3436 which is the target level of 161.8% (blue dotted line).
Alternative scenario: When moving up and reaching the historical resistance level of 1.3393 (blue dotted line), the price may start moving down with the target of 1.3290 which is a pullback level of 14.6% (red dotted line).


