To open long positions on GBPUSD, you need:
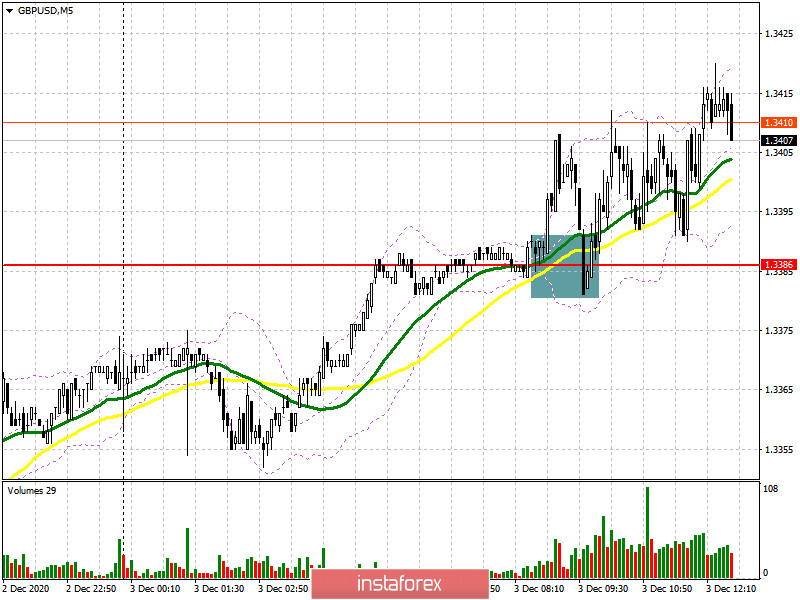
In its morning forecast, I recommend opening long positions after the break and consolidation above the level of 1.3386, which is what happened. Let's look at the 5-minute chart and find out what happened. It is visible how the bulls achieve a breakout of 1.3386, after which there is a sharp increase in the pair. A downward correction to this level from the reverse side formed a fairly good signal to open long positions, which is still valid at the moment.

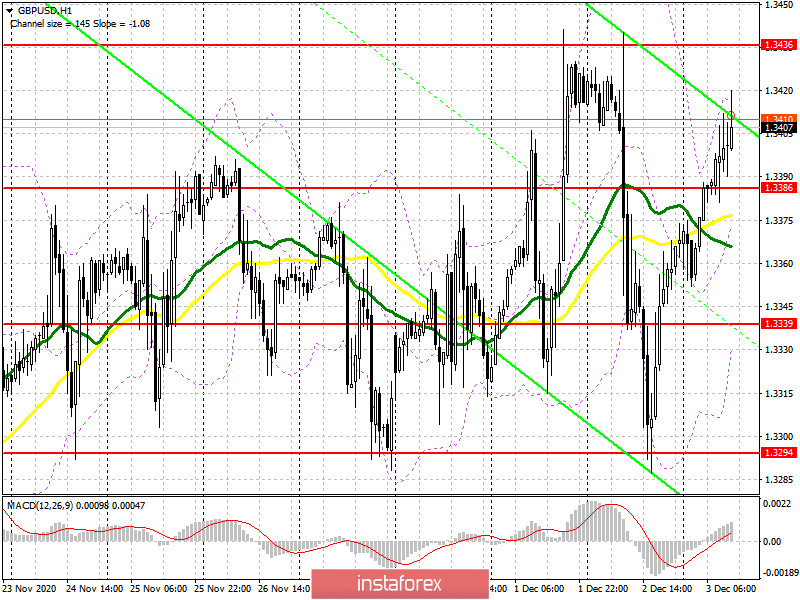
The initial task of the bulls is to maintain control over the level of 1.3386, from which the pair's growth resumed today. If the price falls to this level, only the formation of a false breakout will lead to a new wave of growth of the pound. An equally important target for buyers is to break through and consolidate above the resistance of 1.3436, where sellers' stop orders are located. A top-down test of this level forms an excellent entry point for long positions, similar to the morning purchase from 1.3386. In this case, we can expect a more powerful bullish momentum in the area of the high of 1.3509. However, only good news on the Brexit trade agreement will open the way to the area of 1.3563 and 1.3604, where I recommend fixing the profits. In the scenario of another decline in GBP/USD to the middle of the channel of 1.3386 and the lack of activity on the part of buyers, it is best to postpone long positions until the minimum of 1.3339 is updated or buy the pound immediately on the rebound from the larger support of 1.3294 in the expectation of an upward correction of 30-40 points within the day.
To open short positions on GBPUSD, you need:
Sellers failed to meet the morning target and failed to defend the resistance of 1.3386 after a report that pointed to a less active contraction in the UK services sector than expected, which returned a positive mood to the market. Now the bears should focus on the resistance of 1.3436, as only the formation of a false breakout will be a signal to sell the pound in the second half of the day. In the event of a lack of activity in this area and weak data on the US service sector, it is best to abandon sales before testing a new high of 1.3509. But at the same time, you need to understand that if an agreement is reached on Brexit, the pound can quickly fly above 1.3509 to the area of highs of 1.3563 and 1.3604. Thus, be careful with this issue and monitor the news on Brexit. If the GBP/USD declines in the second half of the day, only a breakout with consolidation below 1.3386 will increase the pressure on the pair, which will quickly push it to the lows of 1.3339 and 1.3294, where I recommend fixing the profits. Another failure of trade negotiations will lead to a breakdown of 1.3294 and a collapse of the pound in the area of 1.3194 and 1.3034.

Let me remind you that in the COT reports (Commitment of Traders) for November 24, there was an increase in long positions and a small influx of short ones. Long non-profit positions increased from 27,454 to 30,838. At the same time, short non-profit positions increased only slightly from 47,200 to 47,968. As a result, the negative non-commercial net position was -17,130 against -19,746 a week earlier. Of course, this points to the preservation of control by sellers of the British pound and their preponderance in the current situation, however, the market is beginning to gradually come back to the risks, and reaching a trade agreement will help it in this.
Signals of indicators:
Moving averages
Trading is just above 30 and 50 daily averages, indicating that buyers are trying to take control of the market.
Note: The period and prices of moving averages are considered by the author on the hourly chart H1 and differ from the general definition of the classic daily moving averages on the daily chart D1.
Bollinger Bands
In case of a decline, the lower border of the indicator around 1.3339 will provide support.
Description of indicators
- Moving average (moving average determines the current trend by smoothing out volatility and noise). Period 50. The graph is marked in yellow.
- Moving average (moving average determines the current trend by smoothing out volatility and noise). Period 30. The graph is marked in green.
- MACD indicator (Moving Average Convergence / Divergence - moving average convergence / divergence) Fast EMA period 12. Slow EMA period 26. SMA period 9
- Bollinger Bands (Bollinger Bands). Period 20
- Non-profit speculative traders, such as individual traders, hedge funds, and large institutions that use the futures market for speculative purposes and meet certain requirements.
- Long non-commercial positions represent the total long open position of non-commercial traders.
- Short non-commercial positions represent the total short open position of non-commercial traders.
- Total non-commercial net position is the difference between the short and long positions of non-commercial traders.


