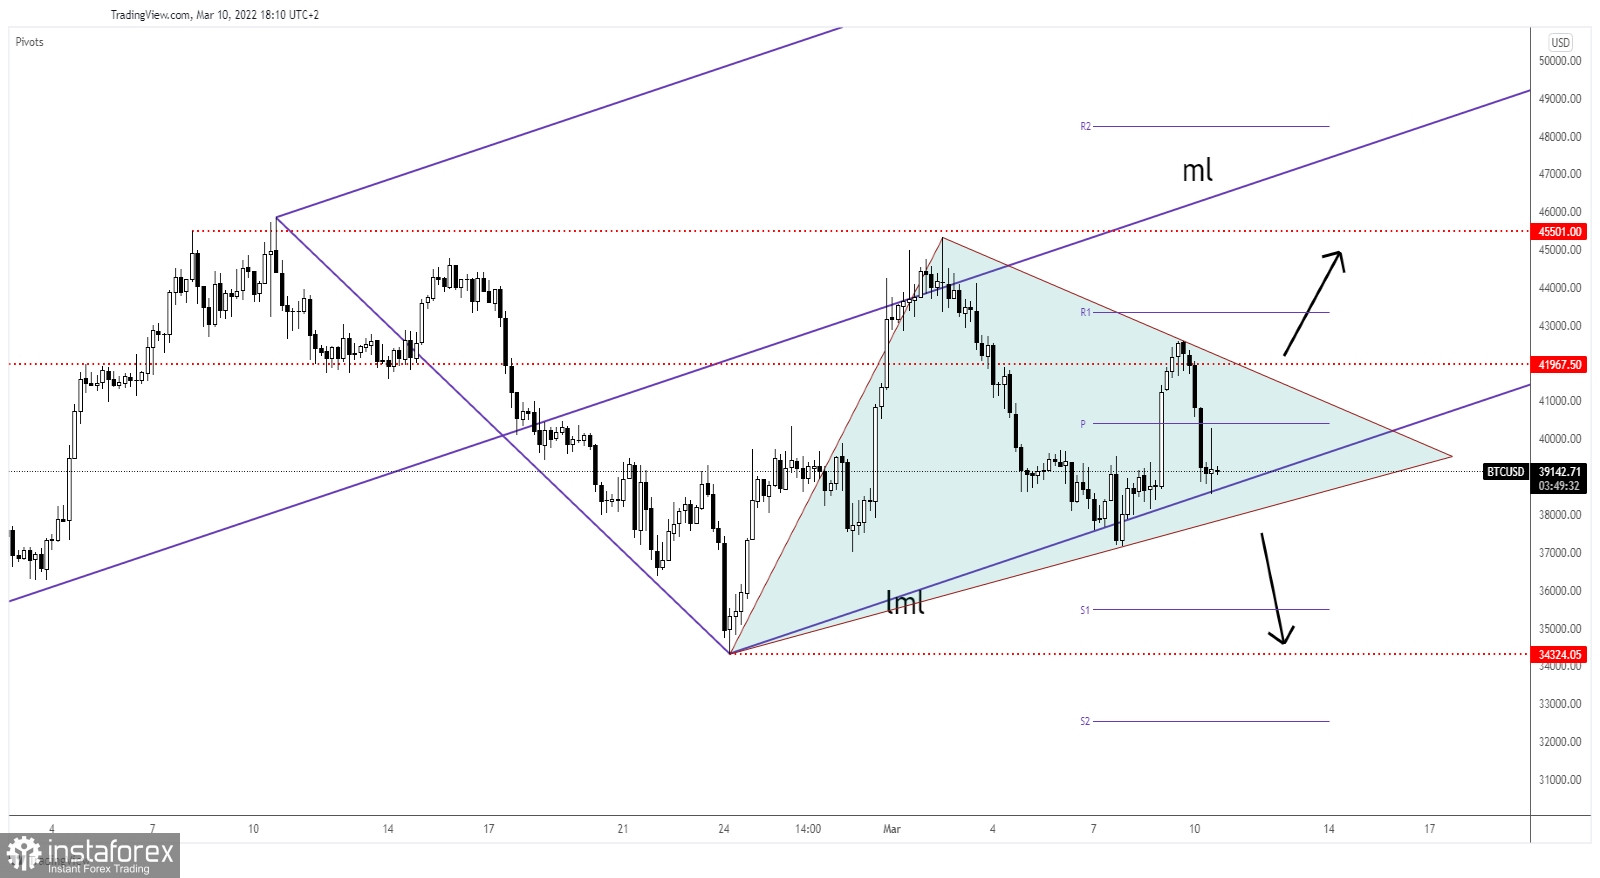
Bitcoin changed little in the last hours. It's trading at 39,204 at the time of writing. The price action failed to confirm further growth, so the bias remains bearish. In the short term, BTC/USD developed a triangle pattern, so we'll have to wait for the crypto to escape from this formation before taking action.
BTC/USD dropped by 9.50% from yesterday's high of 42,591.68 to 38,545.19 today's low. In the last 24 hours, BTC/USD is down by 7.80% and by 8.18% in the last 7 days. Bitcoin's drop forced the altcoins to drop as well.
BTC/USD Bearish Pressure!

BTC/USD plunged after failing to stabilize above the 41,967 static resistance. Now, it has reached the ascending pitchfork's lower median line (lml) which represents dynamic support. As you can see, the price of bitcoin developed a triangle formation. Escaping from this pattern could bring great opportunities.
After failing to reach the weekly R1 (43,367), BTC/USD signaled a potential sell-off. Still, only a valid breakdown below the immediate dynamic support lines could really activate a larger drop.
BTC/USD Prediction!
As long as it stays above the ascending pitchfork's lower median line (lml), BTC/USD could still develop a new leg higher. A valid breakdown from the current triangle may open the door for a larger drop. On the other hand, an upside breakout from the chart pattern and above 41,967 could activate a strong growth.


