Crypto Industry News:
Gas fees for transactions on the Ethereum blockchain have dropped to their lowest levels since last August, but are still not low.
According to data from Coin Metrics and provided by the CryptoRank platform, the seven-day average Ethereum transaction cost yesterday was $ 11.14. This puts it back among the levels seen in the middle of last year, before skyrocketing to $ 55 in late 2021. Etherscan data estimates gas charges of around 30 Gwei ($ 1.53) per confirmation at low speed to 32 Gwei ( 1.64 USD) for quick confirmation.
The Ycharts data also shows that the average price of ETH has fallen sharply since the start of the year, from 218 Gwei on January 10 to 40.82 Gwei on Wednesday.
Due to the dynamic growth of the NFT and DeFi Ethereum sectors in 2021, the network was repeatedly under attack due to outrageously high gas charges.
Lower fees appear to correlate with declining speculation and interest in NFT and DeFi trading earlier this year compared to the end of 2021.
As for the past 30 days, DappRadar data shows that nine of the top 10 Ethereum markets saw a reduced trading volume, with LooksRare and OpenSea losing 78.27% and 34.75% respectively. Other significant losses are SuperRare and Rarible with 73.29% and 80.65% each.
Ethereum-based DeFi also suffers. Eight of the top 10 projects are "lit red" in the past month in terms of Total Locked Value (TVL) and Native Asset Token Price.
Technical Market Outlook
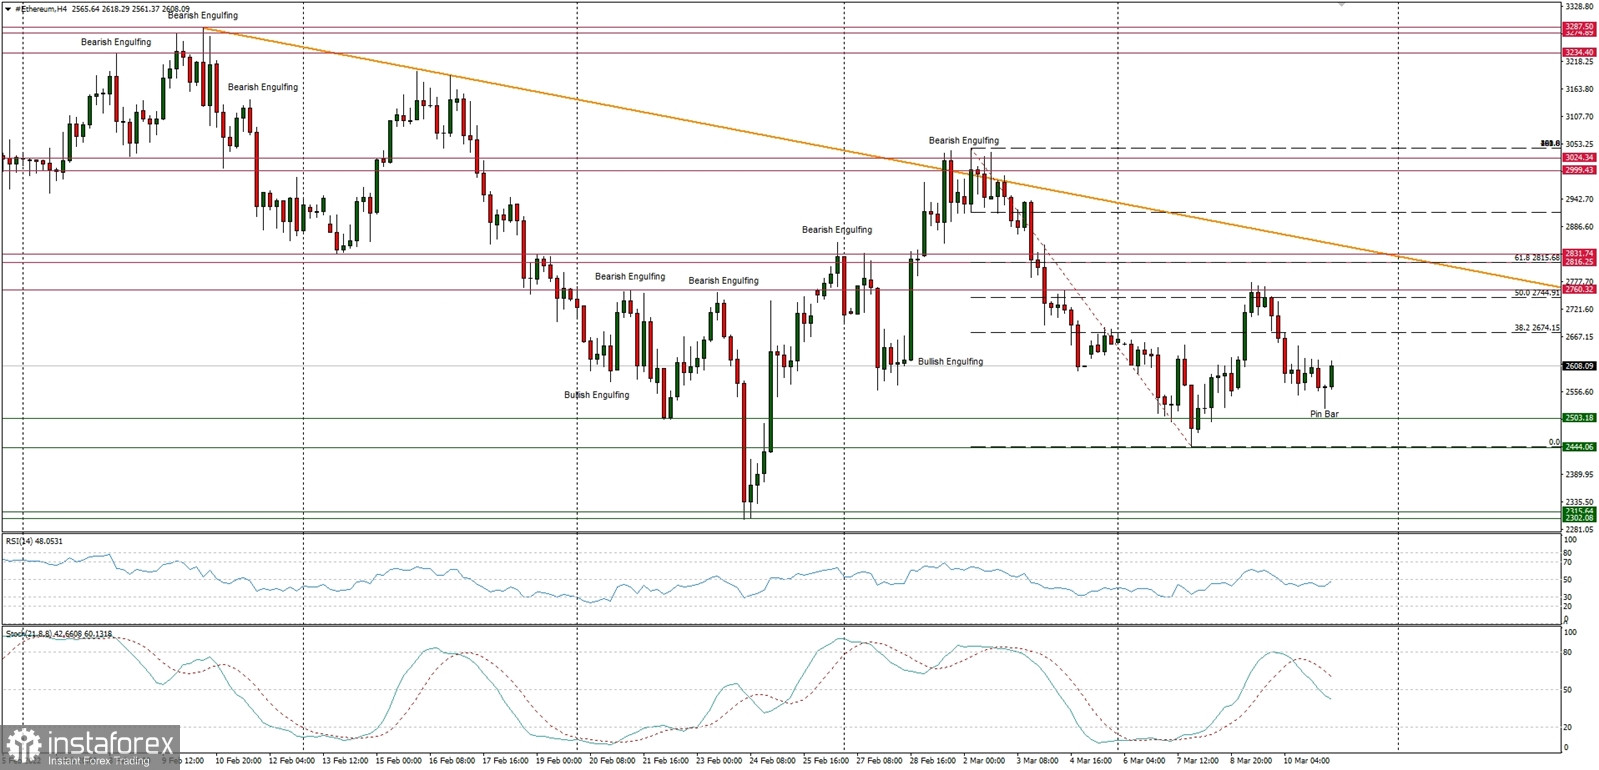
The ETH/USD pair has bounced from the temporary bottom seen at the level of $2,523 after the Pin Bar candlestick formation was made at the H4 time frame. The next target for bulls is seen at the level of $2,650 and $2,760, however, the market conditions are coming off the extremely overbought conditions as well, so with the negative momentum on the H4 time frame, the down move might be continued towards the technical support seen at $2,503 and $2,444.
Weekly Pivot Points:
WR3 - $3,323
WR2 - $3,179
WR1 - $2,855
Weekly Pivot - $2,718
WS1 - $2,386
WS2 - $2,240
WS3 - $1,190
Trading Outlook:
The market keeps trying to bounce higher after over the 50% retracement made since the ATH at the level of $4,868 was made. The level of $3,192 is the next key Fibonacci retracement for bulls, but the bulls had failed to break through three times already. On the other hand, the next long-term technical support is located at $1,721 (61% Fibonacci retracement of the last big impulsive wave up) is still the key long-term.


