Long positions on EUR/USD
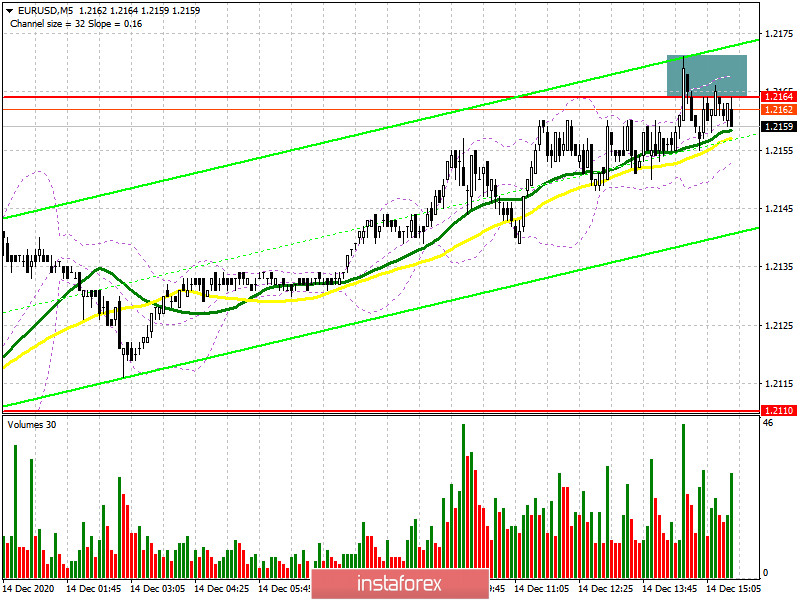
Nothing important happened in the morning session. On the 5-minute chart, you can see how bulls have gradually pushed the pair back to the resistance area at 1.2164 which bears are actively fighting for at the moment. The lack of fundamental data affects trading volatility.

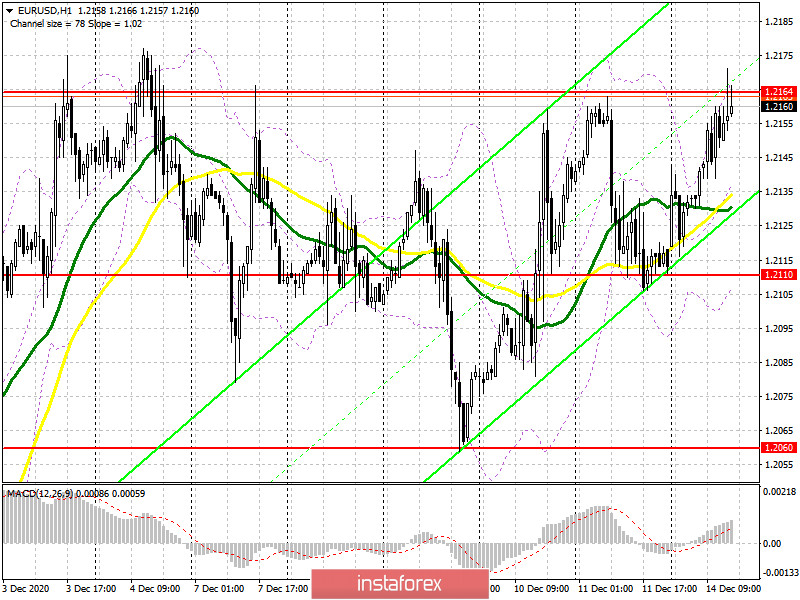
In the second half of the day, the bulls will aim to break above and consolidate near the level of 1.2164, which they have failed to do so far. Only if the price tests this area from top to bottom on big volumes, a buy signal will be generated. It will indicate the continuation of the bullish trend until the high of 1.2255 where I recommend taking profit. An area of 1.2339 remains a more distant target. If the price retests this level, it will mean a further uptrend for the euro. However, if the bulls fail to reach the target later in the day, the EUR/USD is likely to start a downward correction. In this case, the pair will return to the morning support area at 1.2110. A false breakout will be a signal to open long positions. I recommend buying the euro immediately on a rebound from the low of 1.2060, keeping in mind a possible upward correction of 15-20 pips within the day.
Short positions on EUR/USD
At the moment, the pound sellers are focused on holding near the level of 1.2164, and they have already formed a false breakout there. As long as the pair is trading below this range, the euro could come under pressure at any time. In this case, the nearest target will be located at the morning support of 1.2110 where I recommend taking profit. The breakout of this level will increase the pressure on EUR/USD. This will push the pair to new weekly lows of 1.2060 and 1.1986, which will completely dash buyers' hopes for the continuation of the bullish trend. If the pair loses bullish momentum and stays below the resistance of 1.2164 in the afternoon, it is better not to rush with opening short positions. In this scenario, you can only trade short from the level of 1.2255 or from a new high found in the area of 1.2339, keeping in mind the downward correction of 15-20 pips within the day.

Let me remind you that the COT report (Commitment of Traders) for December 8 showed an increase in long positions and a decline in short positions. Buyers of risky assets believe that the bullish trend will continue and the euro will rise further after the breakthrough of the psychologically important level of 20. Thus, long non-commercial positions increased from 207,302 to 222,521, while short non-commercial positions fell to 66,092 from 67,407. The total number of non-commercial net positions rose to 156,429 from 139,894 a week earlier. It is worth noting that the delta has been growing for the third week in a row, which completely offsets the bearish trend observed in the early fall. We may see a major recovery only after the European leaders negotiate a new trade agreement with the UK.
Indicator signals
Moving averages
The pair is trading just above the 30 and 50-day moving averages, which indicates an attempt to resume the bullish trend.
Please note that the time period and prices on the moving averages are based on the H1 chart and differ from the general definition of the classic daily moving averages on the D1 chart.
Bollinger Bands
A breakout from the lower boundary of the indicator at 1.2110 will lead to a larger decline in the euro. A breakout from the upper boundary of the indicator at 1.2165 will lead to an uptrend on the pair.
Description of indicators
• 50-day moving average determines the current trend by filtering out volatility and market noise. It is marked in yellow on the chart.
• 30-day moving average determines the current trend by filtering out volatility and market noise. It is marked in green on the chart.
• MACD indicator (Moving Average Convergence/Divergence). Fast EMA period is 12 days. Slow EMA period is 26 days. SMA period is 9 days.
• Bollinger Bands: 20-day period
• Non-commercial traders are speculators such as individual traders, hedge funds, and large institutions that use the futures market for speculative purposes and meet certain requirements.
• Non-commercial long positions represent the total number of long positions opened by non-commercial traders.
• Non-commercial short positions represent the total number of short positions opened by non-commercial traders.
• Total non-commercial net position is the difference between short and long positions of non-commercial traders.


