


In order to open long positions on EUR/USD, you should:
Nothing important happened in the first half of the day. A similar situation was observed yesterday. According to the M5 chart, bulls managed to return the price to the area of the resistance level of 1.2164. The lack of important fundamental statistics at the beginning of this trading week is affecting market volatility.
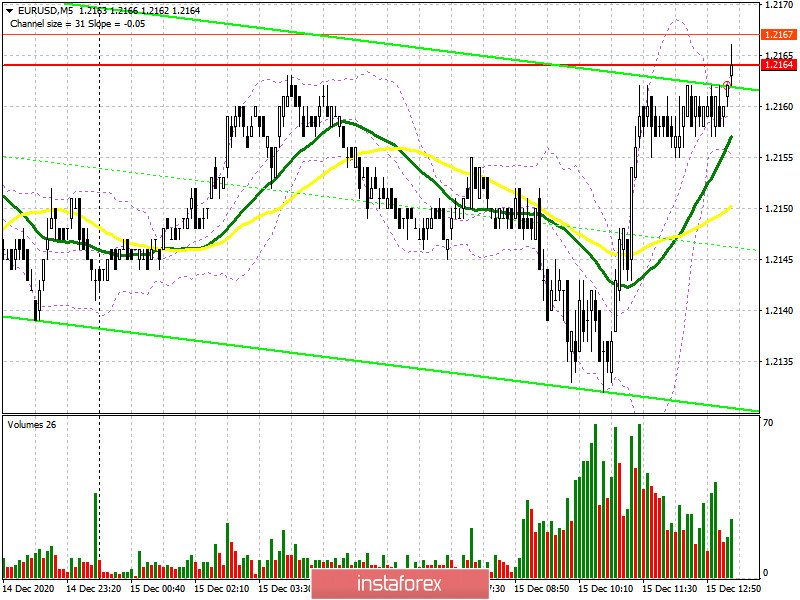
In the second half of the day, bulls' task is to break through the level of 1.2164 and consolidate above it. So far, their attempts to do so have failed. Only a test of this area from above can give a buy signal. In this case, the target is seen in the region of the high of 1.2211. This is the level where traders should take profit. Other targets are seen at 1.2255 and 1.2339. If the pair manages to reach 1.2339, the bullish trend will continue. Otherwise, if bulls fail to complete the task for the second half of the day and the US industrial production report turns out to be positive, exerting pressure on the currency pair, one should refrain from entering long. The best thing to do is to wait for the price to fall to the morning support of 1.2110. A false breakout at this level may give a buy signal. I recommend that you buy the euro immediately on a rebound from the low of 1.2060 given that an upward correction of 15-20 pips can occur within the day.
In order to open short positions on EUR/USD you should:
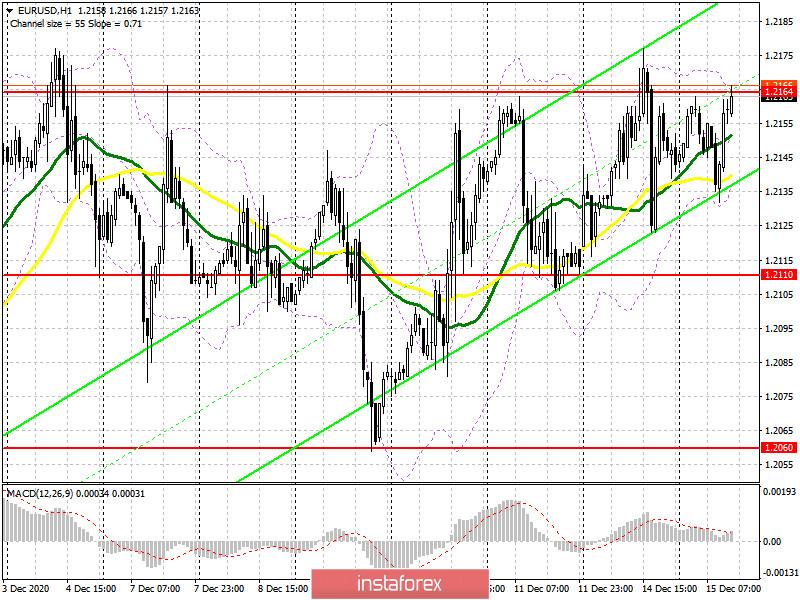
Currently, bulls are trying to protect the level of 1.2164. Trading is likely to take place below this range at the moment,. The pressure on the euro could return any time soon. A false breakout near 1.2164 may give an additional sell signal. In such a case, the nearest target is seen at the morning support of 1.2110, where it is best to take profit. A breakout at this point is likely to only increase pressure on EUR/USD. Consequently, the pair may reach the weekly lows of 1.2060 and 1.1986. As a result, the hopes of bears for the continuation of the upward trend may be destroyed. Thus, if EUR/USD is above the resistance of 1.2164 in the second half of the day and bulls are inactive, one should refrain from selling the instrument. In this case, one should enter short only from 1.2211 or sell EUR/USD already from the new high in the area of 1.2255 given that a downward correction of 15-20 pips can occur within the day.
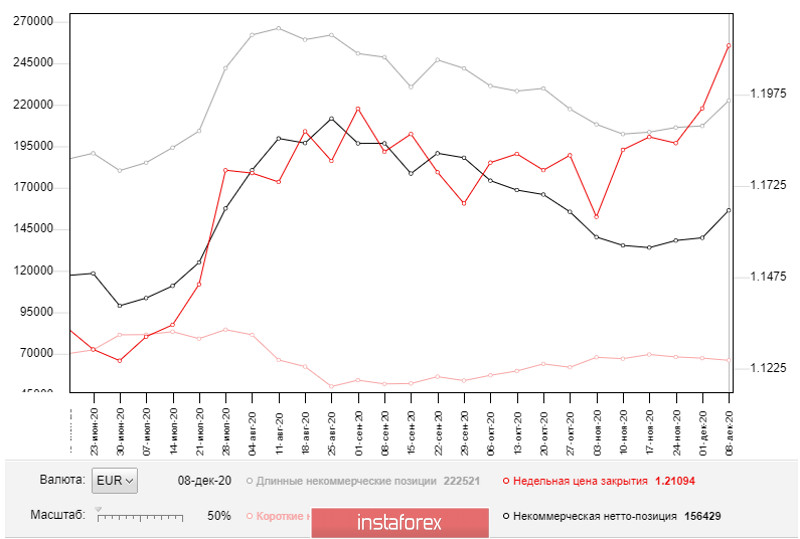
As for the Commitment of Traders (COT) report presented on December 8, the number of long positions increased, while the number of short positions decreased. The buyers of risky assets believe in the continuation of the bullish trend and further growth in the price of the euro. Thus, the number of long non-commercial positions advanced to 222,521 from 207,302, while the number of short non-commercial net positions jumped to 156,429 from 139,894 recorded last week. Notably, delta has been rising for the third week in a row, which completely cancels the bearish trend observed at the beginning of autumn. A more significant recovery will be possible only if European leaders reach a new trade agreement with the United Kingdom.
Indicator signals:
Moving averages
Trading takes place slightly above the 30 and 50 day moving averages, indicating a sideways trend.
Note: The period and prices of moving averages are considered by the author of the article on the hourly chart and differ from the general definition of the classic daily moving averages on the daily chart.
Bollinger Bands
The volatility is on a very low level, which does not give signals to enter the market.
Description of indicators
• Moving average (determines the current trend by smoothing volatility and noise). Period 50. Marked in yellow on the chart.
• Moving average (determines the current trend by smoothing volatility and noise). Period 30. Marked in green on the chart.
• MACD indicator (Moving Average Convergence/Divergence) Fast EMA period 12. Slow EMA period 26. SMA period 9
• Bollinger Bands. Period 20
• Nonprofit traders are speculators such as individual traders, hedge funds, and large institutions that use the futures market for speculative purposes and meet certain requirements.
• Long non-commercial positions represent the total long open position of non-commercial traders.
• Non-commercial short positions represent the total short open position of non-commercial traders.
• The total non-commercial net position is the difference between short and long positions of non-commercial traders.


