


To open long positions on GBP/USD, you need to:
In my morning forecast, I recommended opening long positions after a breakout and consolidation above the resistance of 1.3489, which happened. On the 5-minute chart, the bulls break above 1.3489, after which there is a great test of this level from the bottom up, which forms a good signal to buy the pound. Data on activity in the manufacturing sector and the UK service sector led to a larger increase in GBP/USD already in the resistance area of 1.3534, where I recommended taking profits and advised selling the pound on a rebound with a correction of 25-30 points.
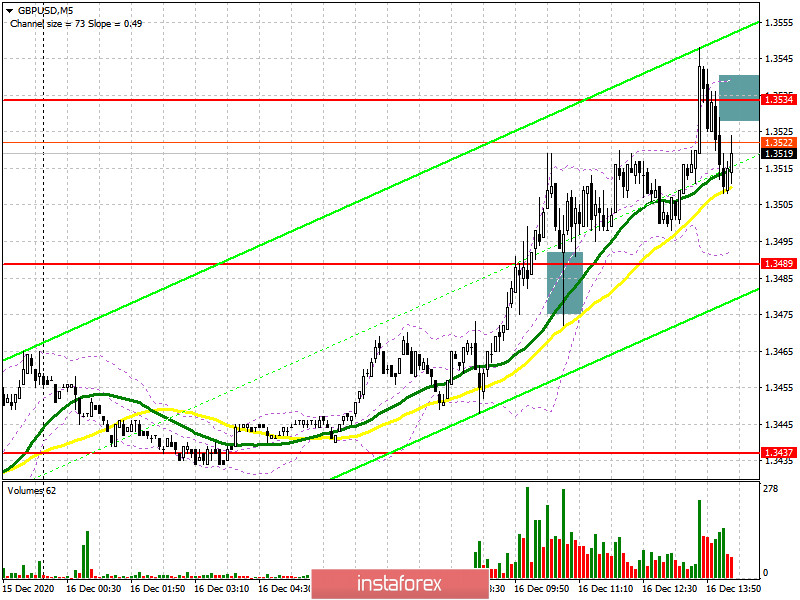
In the second half of the day, the main task of buyers will be to break and consolidate above the resistance of 1.3534. A test of this level from top to bottom, similar to the morning purchase, forms a good signal to open new long positions in the continuation of the strengthening of GBP/USD, which will allow the pair to go beyond the wide side channel in which it has been since the beginning of December this year. The nearest target of the bulls will be the resistance of 1.3604, the breakdown of which will quickly throw the pair to the area of 1.3648 and 1.3698, where I recommend taking the profits. If the pressure on the pound returns before the publication of the Federal Reserve's decision on interest rates or in the case of good data on activity in the United States, I recommend looking at purchases from the level of 1.3475, provided that a false breakdown is formed. You can buy GBP/USD immediately on the rebound from the minimum of 1.3406 in the expectation of a correction of 20-30 points within the day. There are also moving averages that play on the side of buyers of the pound.
To open short positions on GBP/USD, you need to:
Judging by what we are now seeing in the market, only bad news on the Brexit trade agreement will lead to a collapse of the GBP/USD. While the bull market is observed in all its glory and investors firmly believe that the negotiators will be able to find a compromise. At the moment, sellers of the pound need to form a false breakout in the resistance area of 1.3534. But if after this active downward movement in the pound does not occur, it is better not to go against the trend, but wait for the resistance update at 1.3604, from where you can sell the pound immediately on a rebound, counting on a correction of 20-30 points within the day. Larger resistance levels are seen in the area of 1.3648 and 1.3698. An equally important task for the bears in the second half of the day will be to regain control over the level of 1.3475, which will seriously affect the positions of buyers of the pound. Fixing and testing this level from the bottom up forms a good sell signal, the main goal of which will be the lows in the area of 1.3406 and 1.3345, where I recommend fixing the profits.
Let me remind you that in the COT reports (Commitment of Traders) for December 8, there is a significant interest in the British pound. Long non-commercial positions rose from 37,087 to 39,344. At the same time, short non-commercial positions decreased from 44,986 to 33,634. As a result, the non-commercial net position became positive and jumped to 5,710 against a negative value of -7,899 a week earlier. All this suggests that traders are ready to bet on further strengthening of the pound at the beginning of next year and the preponderance of buyers even in the current situation when there is no agreement on a trade agreement, and just over two weeks are left until the end of the year.
Signals of indicators:
Moving averages
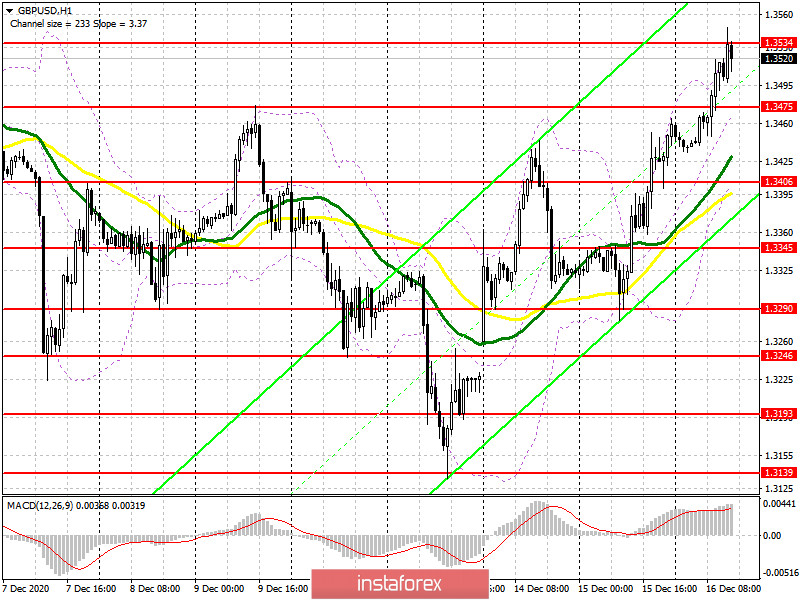
Trading is above 30 and 50 daily averages, which indicates that the pound will continue to recover in the short term.
Note: The period and prices of moving averages are considered by the author on the hourly chart H1 and differ from the general definition of the classic daily moving averages on the daily chart D1.
Bollinger Bands
In the event of a decline in the pair, the average border of the indicator in the area of 1.3370 will act as support.
Description of indicators
- Moving average (moving average determines the current trend by smoothing out volatility and noise). Period 50. The graph is marked in yellow.
- Moving average (moving average determines the current trend by smoothing out volatility and noise). Period 30. The graph is marked in green.
- MACD indicator (Moving Average Convergence / Divergence - moving average convergence / divergence) Fast EMA period 12. Slow EMA period 26. SMA period 9
- Bollinger Bands (Bollinger Bands). Period 20
- Non-profit speculative traders, such as individual traders, hedge funds, and large institutions that use the futures market for speculative purposes and meet certain requirements.
- Long non-commercial positions represent the total long open position of non-commercial traders.
- Short non-commercial positions represent the total short open position of non-commercial traders.
- Total non-commercial net position is the difference between the short and long positions of non-commercial traders.


