To open long positions on EURUSD, you need to:
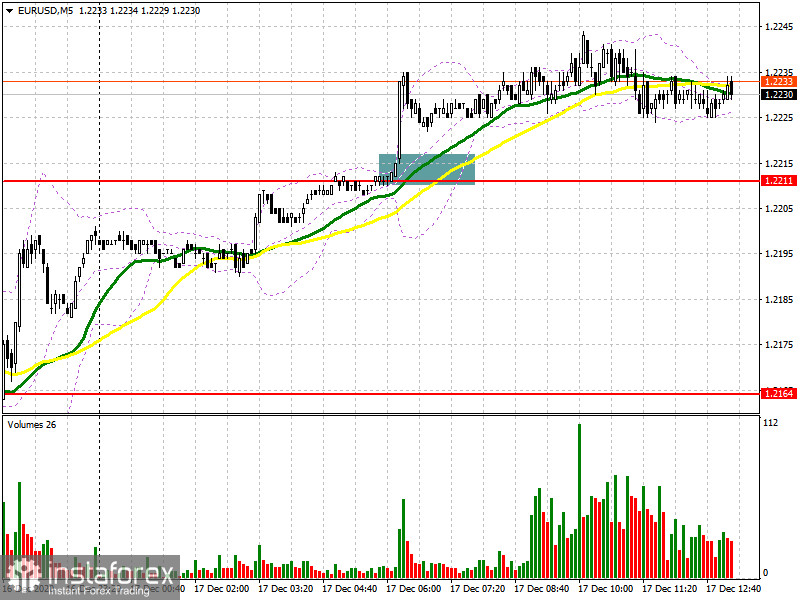
In my morning forecast, I paid attention to the purchase of the euro after the breakdown and consolidation above the resistance of 1.2211, which happened. On the 5-minute chart, we saw how the breakout of the resistance of 1.2211 led to the demolition of several stop orders and rapid recovery of the euro. However, in fairness, it should be noted that I missed this buy signal since we did not return for the test of the level of 1.2211 from the top down. Without such confirmation, as a rule, I do not enter the market. The data on inflation in the Eurozone coincided with the forecasts of economists, so we do not see a continuation of the bull market yet.

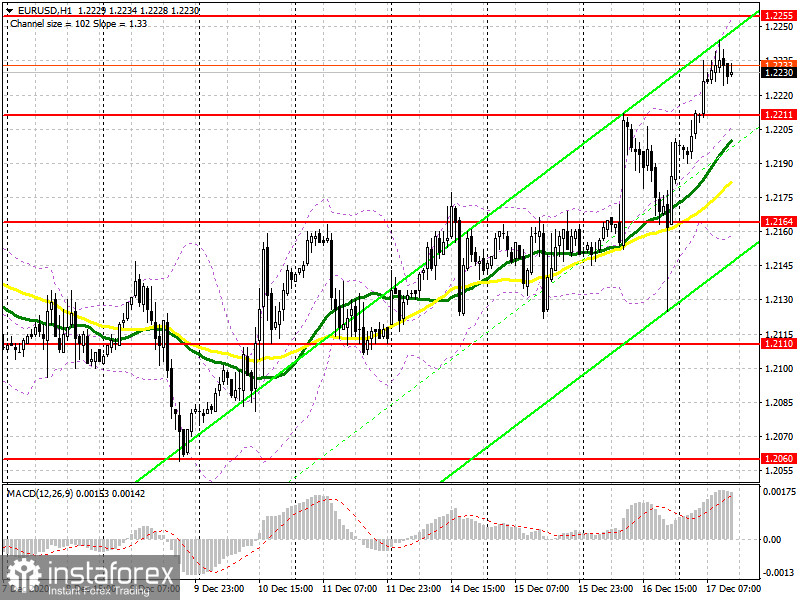
In the afternoon, the entire focus will shift to data on the US labor market. In the case of bad macroeconomic indicators, the pressure on the US dollar will return. In this regard, the main task of buyers now is to break and consolidate above the level of 1.2255, which will lead to a larger upward trend already in the area of weekly targets in the area of 1.2297 and 1.2339, where I recommend fixing the profits. Buyers should not forget about the protection of the support of 1.2211. Testing it from top to bottom and forming a false breakdown after macroeconomic statistics on the state of the American economy, forms a good signal for further building up long positions in the continuation of the trend movement. If there is no bull activity at this level, it is better not to hurry, but to wait for a downward correction to the support area of 1.2164, where the moving averages pass. From this level, you can open long positions immediately for a rebound, based on a rebound of 20-25 points within the day.
To open short positions on EURUSD, you need to:
Most likely, all the attention of sellers of the euro will be shifted to the resistance of 1.2255, which buyers will reach sooner or later today. Only the formation of a false breakout in the second half of the day forms a signal to open short positions, the main purpose of which will be the return of EUR/USD to the level of 1.2211. Fixing and testing this level from the bottom up on volume will lead to a larger sale of the euro to a low of 1.2164. However, it will be possible to talk about a breakdown of this range only after very good fundamental statistics indicating an improvement in the state of the American labor market. In the scenario of a breakout and consolidation above 1.2255 in the afternoon, it is best to postpone new short positions until the test of the larger resistance of 1.2297. I recommend selling EUR/USD immediately for a rebound from the maximum of 1.2339, based on a downward correction of 15-20 points within the day.

Let me remind you that the COT report (Commitment of Traders) for December 8 recorded an increase in long and a reduction in short positions. Buyers of risky assets believe in the continuation of the bull market and further growth of the euro after breaking the psychological mark in the area of the 20th figure. Thus, long non-commercial positions rose from 207,302 to 222,521, while short non-commercial positions fell to 66,092 from 67,407. The total non-commercial net position rose to 156,429 from 139,894 a week earlier. It is worth paying attention to the growth of the delta, observed for the third week in a row, which completely negates the bearish trend observed at the beginning of this fall. A larger recovery can only be talked about after European leaders negotiate a new trade agreement with Britain.
Signals of indicators:
Moving averages
Trading is above 30 and 50 daily moving averages, which indicates a continuation of the bull market.
Note: The period and prices of moving averages are considered by the author on the hourly chart h1 and differ from the general definition of the classic daily moving averages on the daily chart d1.
Bollinger Bands
A break of the upper limit of the indicator in the area of 1.2255 will lead to a new wave of euro growth. If the pair declines, the lower limit of the indicator in the area of 1.2164 will provide support.
Description of indicators
- Moving average (moving average determines the current trend by smoothing out volatility and noise). Period 50. The graph is marked in yellow.
- Moving average (moving average determines the current trend by smoothing out volatility and noise). Period 30. The graph is marked in green.
- MACD indicator (Moving Average Convergence / Divergence - moving average convergence / divergence) Fast EMA period 12. Slow EMA period 26. SMA period 9
- Bollinger Bands (Bollinger Bands). Period 20
- Non-profit speculative traders, such as individual traders, hedge funds, and large institutions that use the futures market for speculative purposes and meet certain requirements.
- Long non-commercial positions represent the total long open position of non-commercial traders.
- Short non-commercial positions represent the total short open position of non-commercial traders.
- Total non-commercial net position is the difference between the short and long positions of non-commercial traders.


