What is needed to open long positions on GBP/USD
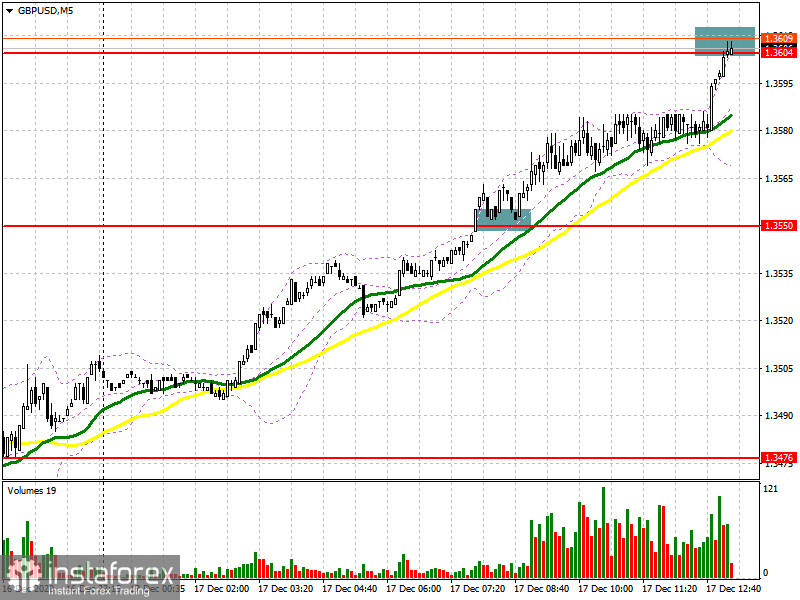
In the first half of the trading day, GBP generated a perfect buy signal. Let's look at a 5-minute chart and find out the best moment for a market entry with long positions betting on GBP further growth. In my morning review, I turned your attention to 1.3550 where I recommended opening long positions. It is clearly seen in the chart that the bulls have pushed the price above 1.3550, holding the pair at this level and trading from the opposite side. Afterwards, GBP/USD made another upward move which allowed traders to earn a profit of over 50 pips.

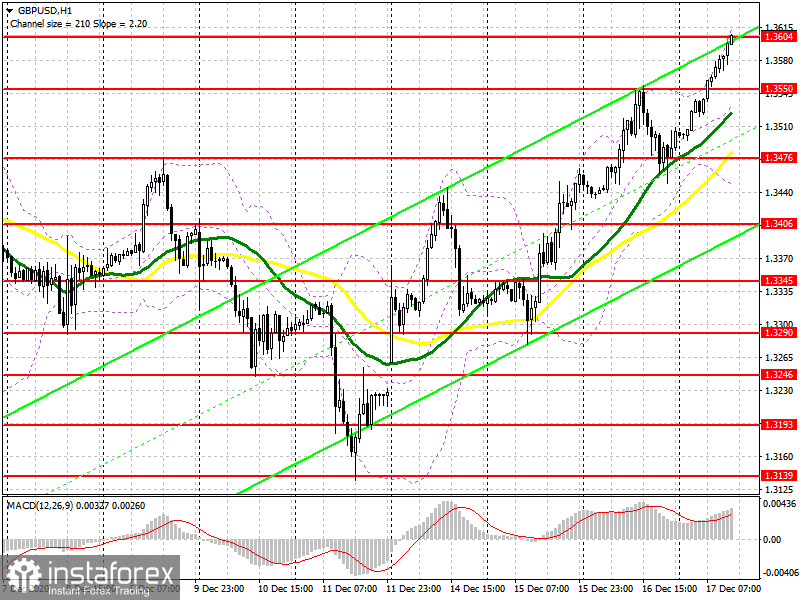
In the second half of the trading day, the buyers set the goal to break resistance of 1.3604 and fix the price above it. Now the pair is holding at this level. If the level is tested downwards like it was with buying in the morning, it would be a good signal to open more long positions betting on further growth of GBP/USD. So, the pair will be able to reach local highs at 1.3648 and 1.3698 where I recommend profit taking. Nevertheless, GBP could come under pressure following the Bank of England policy statement. In this case I would recommend planning long positions on GBP/USD only after a fake breakout at 1.3550. It will be possible to buy the pair immediately at a bounce from the low of 1.3476 bearing in mind a 20-30 pips intraday correction. Besides, moving averages are also passing through this area which is in the buyers' favor.
What is needed to open short positions on GBP/USD
The pair is still trading in the bullish market. Only bad news on the Brexit front could trigger a slump in GBP/USD. Obviously, investors believe that the negotiators from London and Brussels will be able to arrive at a compromise soon. Just imagine how steep the sterling will tumble if the sides fail to settle a deal! At the moment, the sellers have to make a fake breakout at around resistance of 1.3604. They could achieve their aim with the help of the Bank of England policy update as the regulator is expected to keep the bond-buying program at the same volume. If the bears fail to develop an active down move, it would be better not trade against the trend. You would rather wait until GBP/USD hits new resistance following 1.3648 or hit a new higher high of 1.3698. These are the levels where you could sell the pair immediately at a price dip bearing in mind a 20-30 pips intraday correction. The equally important task for the bears in the second half of the day will be to regain control over 1.3550 that will spoil the buyers' mood and affect long positions on GBP. A price fixation and test of this level upwards will generate a good sell signal with downwards targets at 1.3476 and 1.3406 where I recommend profit taking.

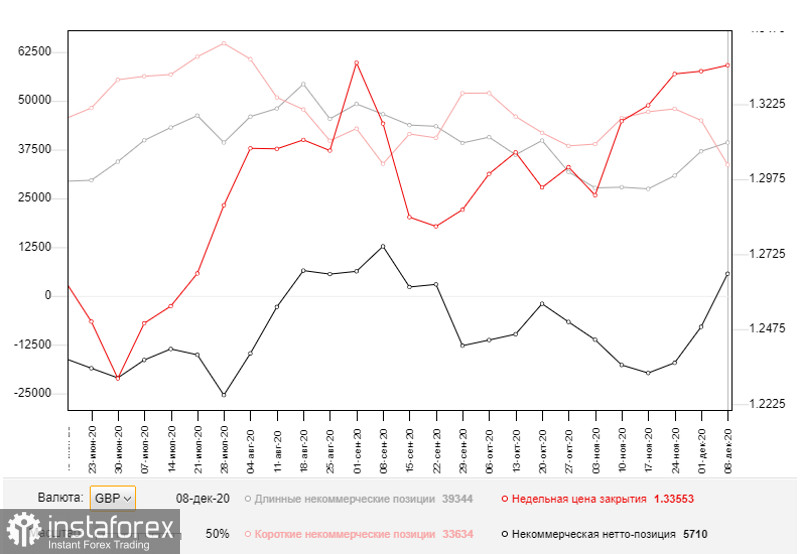
For your reference, on December 8 the Commitment of Traders (COT) report reveals buoyant demand for GBP. Long non-commercial positions increased from 37,087 to 39,344. At the same time, short non-commercial positions declined from 44,986 to 33,634. As a result, the net non-commercial positions entered the positive territory and climbed to 5,710 from -7,899 a week ago. These changes are viewed as evidence that traders are poised to be betting on further GBP strength at the beginning of 2021. So, we could expect that the buyers outweigh even under the current fundamental conditions when the UK and Brussels have not signed a trade deal yet and about two weeks are left before the year end.

Signals of technical indicators
Moving averages
The pair is trading at about 30- and 50-period moving averages. It indicates a further advance of the pound sterling in the short term.
Remark. The author is analyzing a period and prices of moving averages on the 1-hour chart. So, it differs from the common definition of classic daily moving averages on the daily chart.
Bollinger Bands
In case the currency pair retreats, the middle line of the indicator at 1.3540 will serve as support.
Definitions of technical indicators
- Moving average recognizes an ongoing trend through leveling out volatility and market noise. A 50-period moving average is plotted yellow on the chart.
- Moving average identifies an ongoing trend through leveling out volatility and market noise. A 30-period moving average is displayed as the green line.
- MACD indicator represents a relationship between two moving averages that is a ratio of Moving Average Convergence/Divergence. The MACD is calculated by subtracting the 26-period Exponential Moving Average (EMA) from the 12-period EMA. A 9-day EMA of the MACD called the "signal line".
- Bollinger Bands is a momentum indicator. The upper and lower bands are typically 2 standard deviations +/- from a 20-day simple moving average.
- Non-commercial traders - speculators such as retail traders, hedge funds and large institutions who use the futures market for speculative purposes and meet certain requirements.
- Non-commercial long positions represent the total long open position of non-commercial traders.
- Non-commercial short positions represent the total short open position of non-commercial traders.
- The overall non-commercial net position balance is the difference between short and long positions of non-commercial traders.


