


Trend analysis
The price from the level of 1.2254 (closing of the last weekly candle) may make a downward pullback to the support level of 1. 2177 (yellow bold line) this week. After that, it will further rise to the target of 1.2462 – historical resistance level (blue dashed line). Upon reaching this level, the upward movement will continue to the target of 1.2554 (blue dotted line) – upper fractal (weekly candle from 02/11/2018).
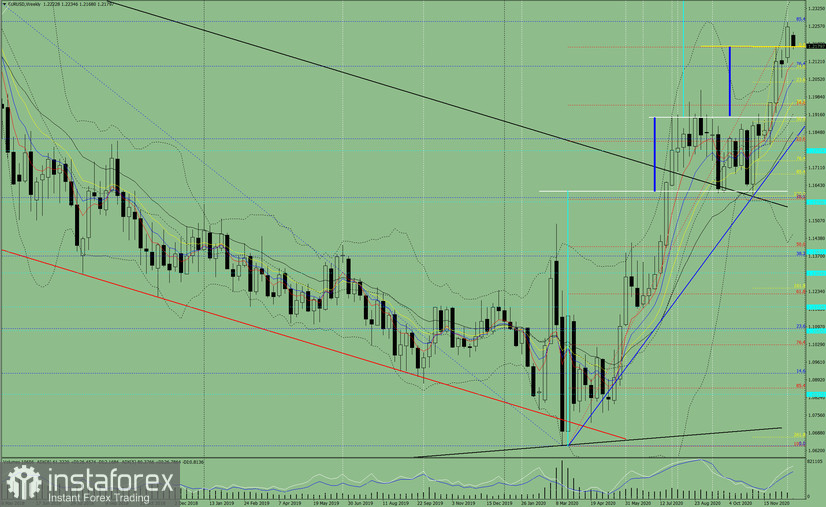
Figure 1 (weekly chart)
Comprehensive analysis:
- indicator analysis - up;
- Fibonacci levels - up;
- volumes - up;
- candlestick analysis - up;
- trend analysis - up;
- Bollinger lines - up;
- monthly chart - up.
An upward movement can be concluded based on comprehensive analysis.
The overall result of the candlestick calculation on the weekly chart: the price is likely to have an upward trend this week, with a lower shadow in the weekly white candlestick (Monday - down) and without an upper shadow (Friday - up).
The first upper target is 1.2462 – the historical resistance level (blue dashed line). Upon reaching this level, the upward movement will continue to the target of 1.2554 (blue dotted line) – upper fractal (weekly candle from 02/11/2018).
An alternative scenario: the price from the level of 1.2254 (closing of the last weekly candle) may decline to the target of 1.2186 – support level (yellow bold line). After reaching this level, it can rise to the target of 1.2462 – historical resistance level (blue dashed line).


