


Trend analysis
The price from the level of 1.3519 (closing of the last weekly candle) will decline to the target of 1.3208 – 13th average EMA (yellow thin line) this week. If this line is tested, upward movement can continue to the target of 1.3623 – the upper fractal (weekly candle from 12/13/20). Upon reaching this level, further growth can be expected to the target of 1.3675 – the pullback level of 76.4% (blue dotted line).
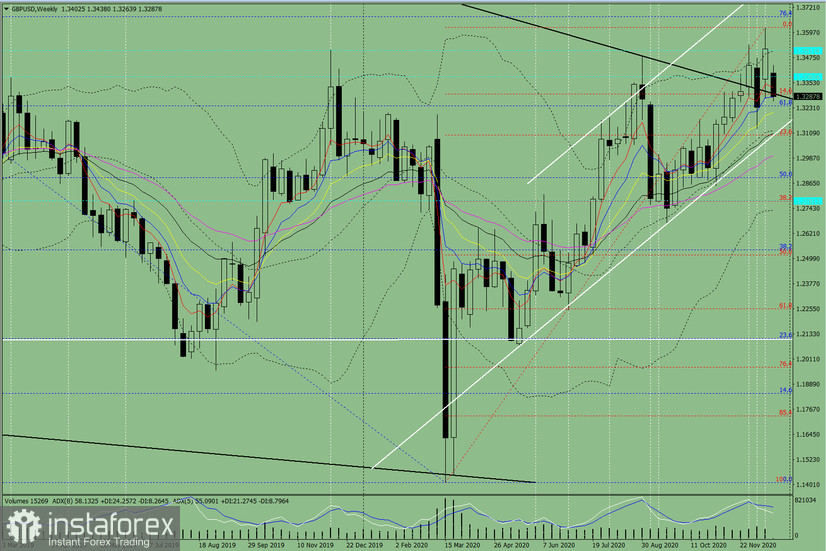
Figure 1 (weekly chart)
Comprehensive analysis:
- indicator analysis - up;
- Fibonacci levels - up;
- volumes - up;
- candlestick analysis - up;
- trend analysis - up
- Bollinger lines - up;
- monthly chart - up.
An upward movement can be concluded based on comprehensive analysis.
The overall result of the candlestick calculation on the weekly chart: the price is likely to have an upward trend this week, with the first lower shadow on the weekly white candlestick (Monday - down) and without the second upper shadow (Friday - up).
The first downward target is 1.3208 – 13th average EMA (yellow thin line). In case of testing this line, upward movement can continue to the target of 1.3623 – the upper fractal (weekly candle from 12/13/20). Upon reaching this level, further growth can be expected to the target of 1.3675 – the pullback level of 76.4% (blue dotted line).
An alternative scenario: the price from the level of 1.3519 (closing of the last weekly candle) can decline to the first target of 1.3208 – 13th average EMA (yellow thin line). After testing this line, it is expected to further decline to the target of 1.3111 – support line (white thick line). From this line, upward movement is possible.


