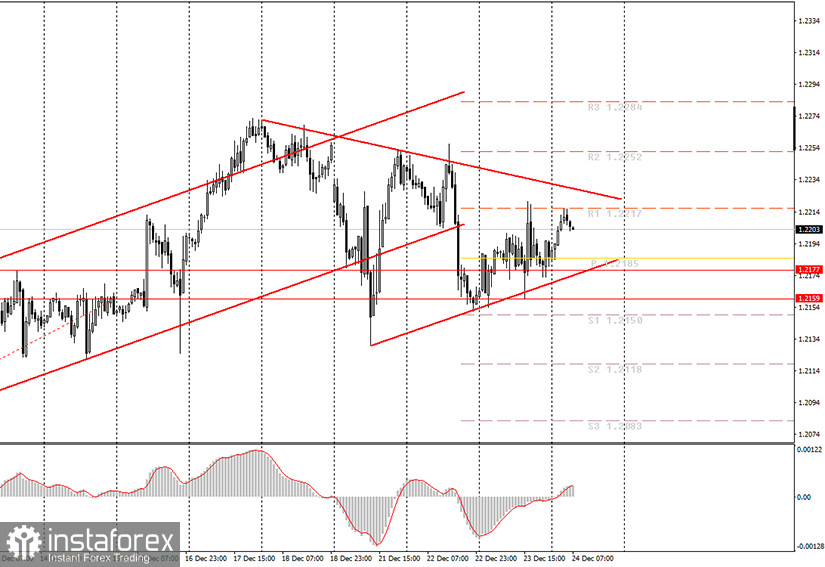
Hourly chart of the EUR/USD pair

The EUR/USD pair did not make any attempt to settle above the downward trend line or below the rising trendline last night. Thus, the quotes remained within these two trend lines, and it was inconvenient to trade between them. We are still leaning towards the return of the downward trend, since a downward trend line was formed earlier and is much stronger. But at the same time, overcoming it will pave the way for the euro to rise. In general, novice traders are encouraged to wait until the pair surpasses one of the two trend lines. The MACD indicator may create a new sell signal in the near future, as it has sufficiently discharged to the upside last night. And we would also recommend trying to work out this signal. Another important assumption is a possible flat (mostly sideways movement). There have been such situations more than once where the price has been in a narrow price range or channel and everyone is waiting for a clear exit from it. However, in practice, the price simply moves sideways and formally overcomes the range, but this is not the way out of it, which we are talking about. There should be a clear movement that will lead the quotes out of the triangle. If the pair leaves it by moving sideways, then no signal will be generated.
No major report or any other event scheduled in America or the EU today. Thus, novice traders will have nothing to pay attention to. Of course, we could receive sudden news at any time (as was the case on Monday with a new strain of coronavirus), but it will not be possible to predict when it would appear for obvious reasons. Since we can say that the holidays are already starting on the sly, the markets may not start moving quite normally. Although, in the context of 2020, nothing was normal at all. Sometimes during the holidays, volatility rises and movements can be erratic, sometimes volatility falls. This point also needs to be clearly defined in order to answer the question, does it make sense to enter the market at all?
Possible scenarios for December 24:
1) Long positions are currently irrelevant, since there is a downward trend line. Thus, we would recommend opening buy positions only when the price has settled above this trend line with targets at the resistance levels of 1.2252 and 1.2284. The trend line is close to the price, so this option is possible today.
2) Trading for a fall looks more appropriate now. The MACD indicator is discharged and may turn down in the near future. The first target in this case will be an upward trend line, which can offer resistance to sellers in their intention to take the pair down. But if this line is crossed, then it will be possible to trade down while aiming for 1.2150 and 1.2118.
On the chart:
Support and Resistance Levels are the Levels that serve as targets when buying or selling the pair. You can place Take Profit near these levels.
Red lines are the channels or trend lines that display the current trend and show in which direction it is better to trade now.
Up/down arrows show where you should sell or buy after reaching or breaking through particular levels.
The MACD indicator (14,22,3) consists of a histogram and a signal line. When they cross, this is a signal to enter the market. It is recommended to use this indicator in combination with trend lines (channels and trend lines).
Important announcements and economic reports that you can always find in the news calendar can seriously influence the trajectory of a currency pair. Therefore, at the time of their release, we recommended trading as carefully as possible or exit the market in order to avoid a sharp price reversal.
Beginners on Forex should remember that not every single trade has to be profitable. The development of a clear strategy and money management are the key to success in trading over a long period of time.


