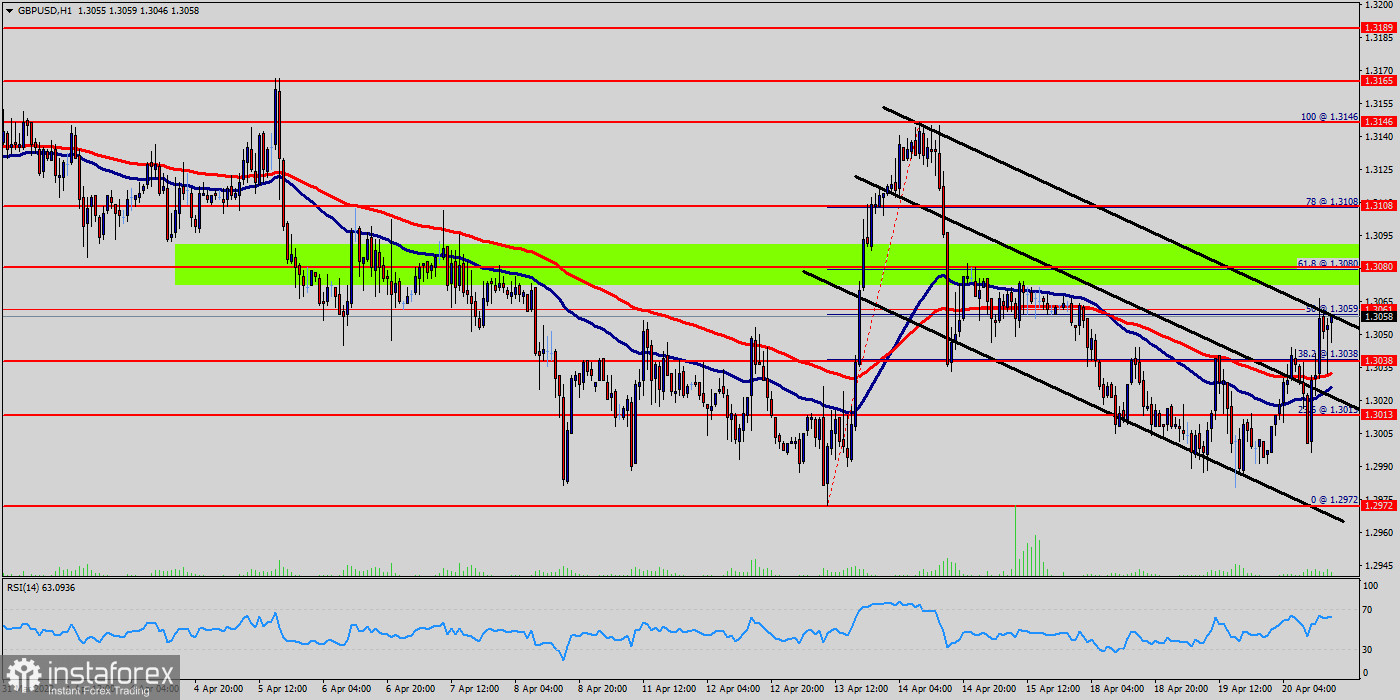
The GBP/USD pair slipped below their immediate resistance levels of 1.3146 and 1.3108, opening the door for further downside.
The GBP/USD pair has remained bearish, the declining balance of Pound on the market indicates that long-term investors are unperturbed and continue to accumulate at every available opportunity around the range of 1.3146 and 1.2972.
The GBP/USD pair broke support which turned to strong resistance at the level of 1.3038. The level of 1.3038 coincides with a golden ratio (61.8% of Fibonacci), which is expected to act as major resistance today. The Relative Strength Index (RSI) is considered overbought because it is around 70 which indicates to a saturation for the Pound.
The RSI is still signaling that the trend is downward - but it is still strong above the moving average (100). This suggests the pair will probably go up in coming hours for correction around the area of 1.3080 or/and 1.3108. Accordingly, the market is likely to show signs of a bullish trend temporary.
If the GBP/USD pair fails to break through the resistance level of 1.3080, the market will decline further to 1.3013. This would suggest a bearish market because the RSI indicator is still in a positive area and does not show any trend-reversal signs.
The pair is expected to drop lower towards at least 1.3013 with a view to test the daily pivot point.
Thus, the market is indicating a bearish opportunity below 1.3080 for that it will be good to sell at 1.3080 with the first target of 1.3013. It will also call for a downtrend in order to continue towards 1.2972. The daily strong support is seen at 1.2972.
On the contrary, if a breakout takes place at the resistance level of 1.3146 (the double top), then this scenario may become invalidated.
Tips :
Fundamental Analysis :
Fundamental analysis is based on the idea that the price of an asset is determined by underlying factors such as the company's performance, management and market size ...etc.
Technical Analysis :
On the other hand, technical analysis does not consider any economic or fundamental factors. It is purely focused on the chart and the indicators like RSI, MACD and candlestick patterns ... etc.
Technical analysis or fundamental analysis
What is the difference between technical analysis and fundamental analysis?
Technical analysis is a type of analysis looks at historical price movements to determine the current trading conditions and possibility price movement. At the same time, fundamental analysis is a type of analysis looks at economic, social, and political forces that impact the supply and demand of an asset.
What is the relation between technical analysis and fundamental analysis?
Technical analysis are pure technical aspect of trading, it is somehow virtual but accurate enough to make money. On the contrary, the fundamental analysis is the real aspect of trading because the market moves according to it.
Overview about this thesis:
Fundamental analysis is the real view of moving the market in the long term. On the opposite side, technical analysis plays an important role in continuing the work of fundamental analysis. Although it seems that technical analysis hypothetical but it works convincingly to a large extent, especially in the weekly analysis. Sometimes I expect the news through technical analysis, and then the news comes according to my expectations.


