


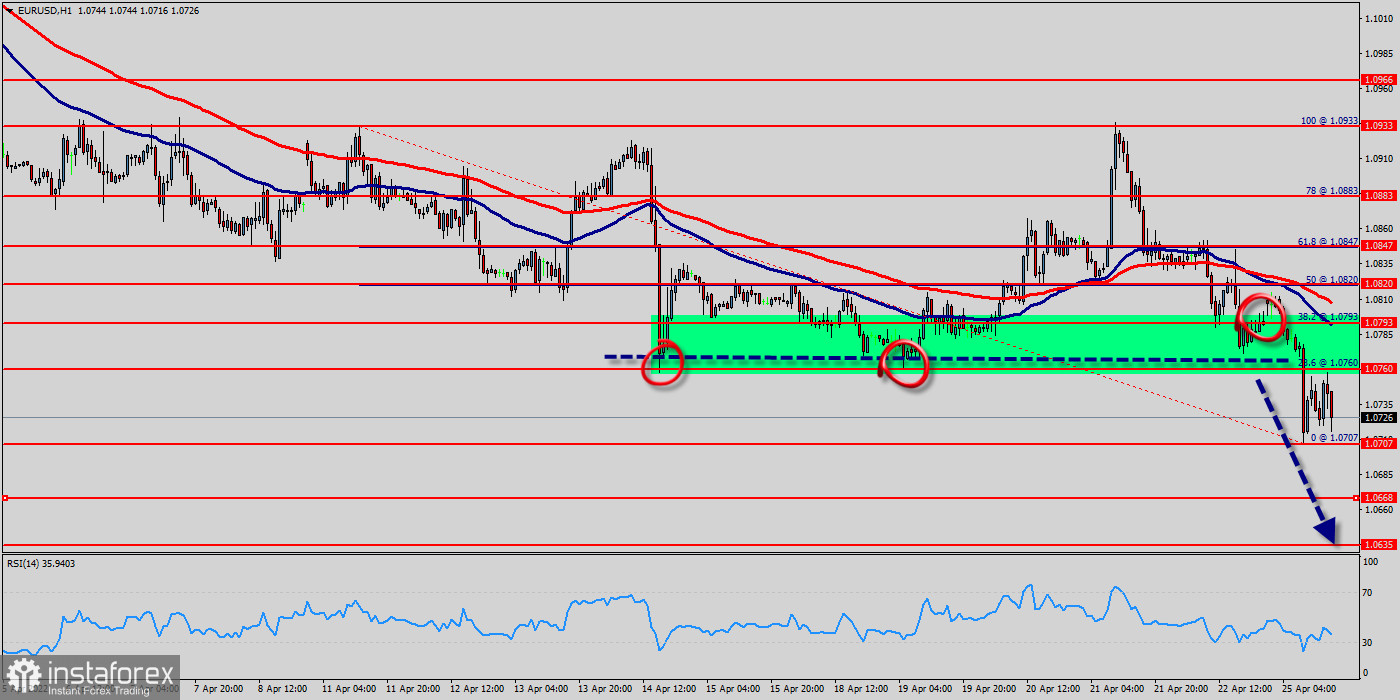
Today, looking at a bearish move for the EUR/USD pair from the levels of 1.0760, 1.0793 and 1.0820 since last week.
Daily resistance at 1.0793 offers an immediate level to work with important due to the number of times buyers failed to overthrow the barrier.
Today, the EUR/USD pair has declined from 1.0820 to 1.0720, reaching a low price on the hourly chart. The pair broke through the support of 1.0793, which became the nearest resistance.
If the pair stages a rebound on improving sentiment, 1.0820 (psychological level) could be seen as the first resistance ahead of 1.0847.
On the hourly chart, the pair fell below the moving average line MA (100) H1 (1.0820) and at the same timeframe - below MA (500) H4 (1.0793). Technically speaking, the support of 1.0707 may keep prices from further decline. The upper limit of 1.0760 represents the resistance level.
Probably, the EUR/USD pair continues to move downwards from the level of 1.0760.
The first support level is seen at 1.0707, the price is moving in a bearish channel now. Furthermore, the price has been set below the strong resistance at the level of 1.0760, which coincides with the 23.6% Fibonacci retracement level.
This resistance has been rejected several times confirming the veracity of a downtrend. Additionally, the RSI starts signaling a downward trend.
As a result, if the EUR/USD pair is able to break out the first support at 1.0707, the market will decline further to 1.0668 in order to test the weekly support 2.
Consequently, the market is likely to show signs of a bearish trend. So, it will be good to sell below the level of 1.0760 with the first target at 1.0707 and further to 1.0668 - next objective 1.0635. However, stop loss is to be placed above the level of 1.0933 (last bullish wave - highest price).


