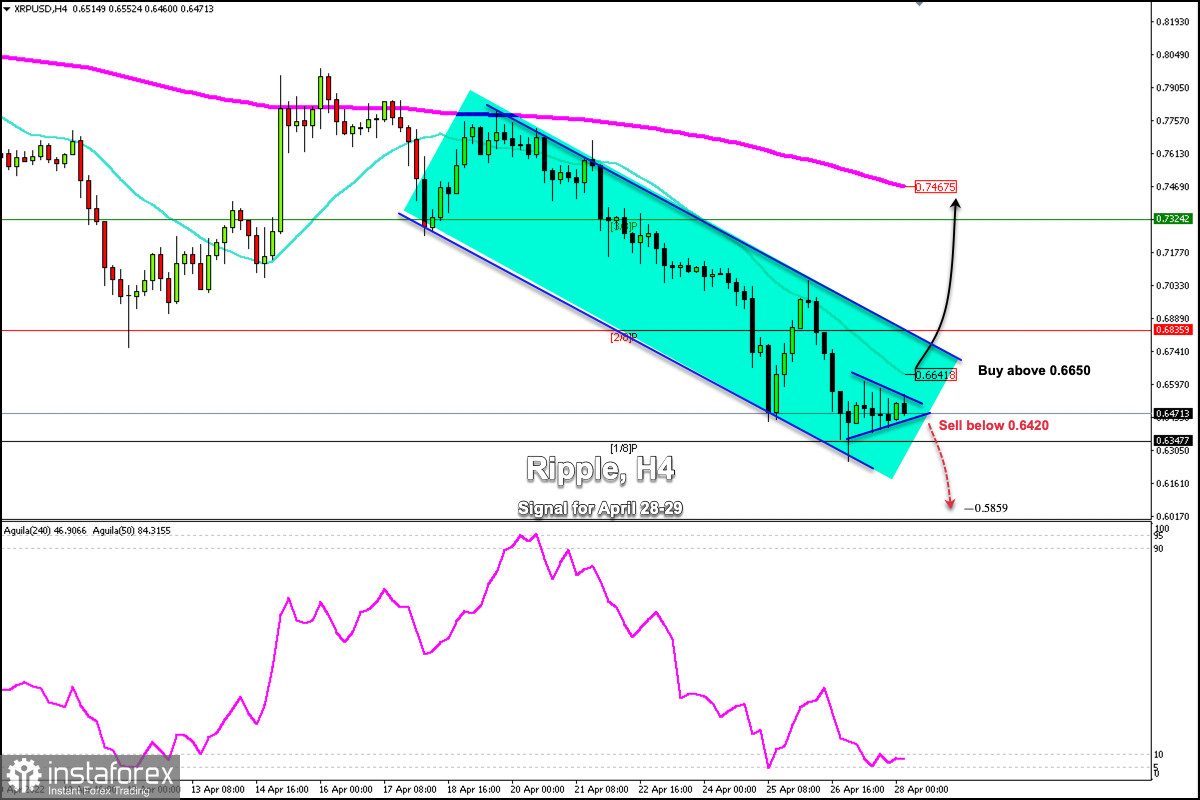
On April 27, Ripple fell to 0.6256. Having found strong resistance at 0.7053 around the 21 SMA, the crypto fell over 14%.
It is currently trading at 0.6471 above the 1/8 Murray and below the 21 SMA located at 0.6641 under strong bearish pressure.
According to the 4-hour chart, XRP has strong resistance at 0.6641. A break and close above the 21 SMA could see a bullish move and rhte price can reach 2/8 Murray at 0.6839 and could even hit the area 3/8 Murray at 0.7324.
We can see the formation of a symmetrical triangle which is a sign that Ripple could go higher in the next few hours. A sharp break above this triangle could head towards the area 0.6839 (2/8 Murray).
On the contrary, if Ripple breaks below the symmetrical triangle in the next few hours, we could expect a bearish continuation and the crypto could reach the psychological level of 0.60 or even 0/8 of Murray at 0.5859.
According to the daily chart, the 200 EMA is at 0.8085. This is a resistance zone and any bounce towards this level in the next few days will be considered as an opportunity to continue selling.
As Bitcoin is being pressured by expectations of an interest rate hike of 0.50% by the FED. As a result, investors are taking refuge in the US dollar and risk assets such as cryptocurrencies are losing their appeal. Based on these fundamentals, the market is likely to remain under strong bearish pressure in the coming weeks.
The increase in the interest rate by the Central Bank of the United States, scheduled for next week, will put the cryptocurrency market under strong downward pressure. In case of a further downtrend, Ripple could reach the key level of 0.50 in the coming weeks.


