


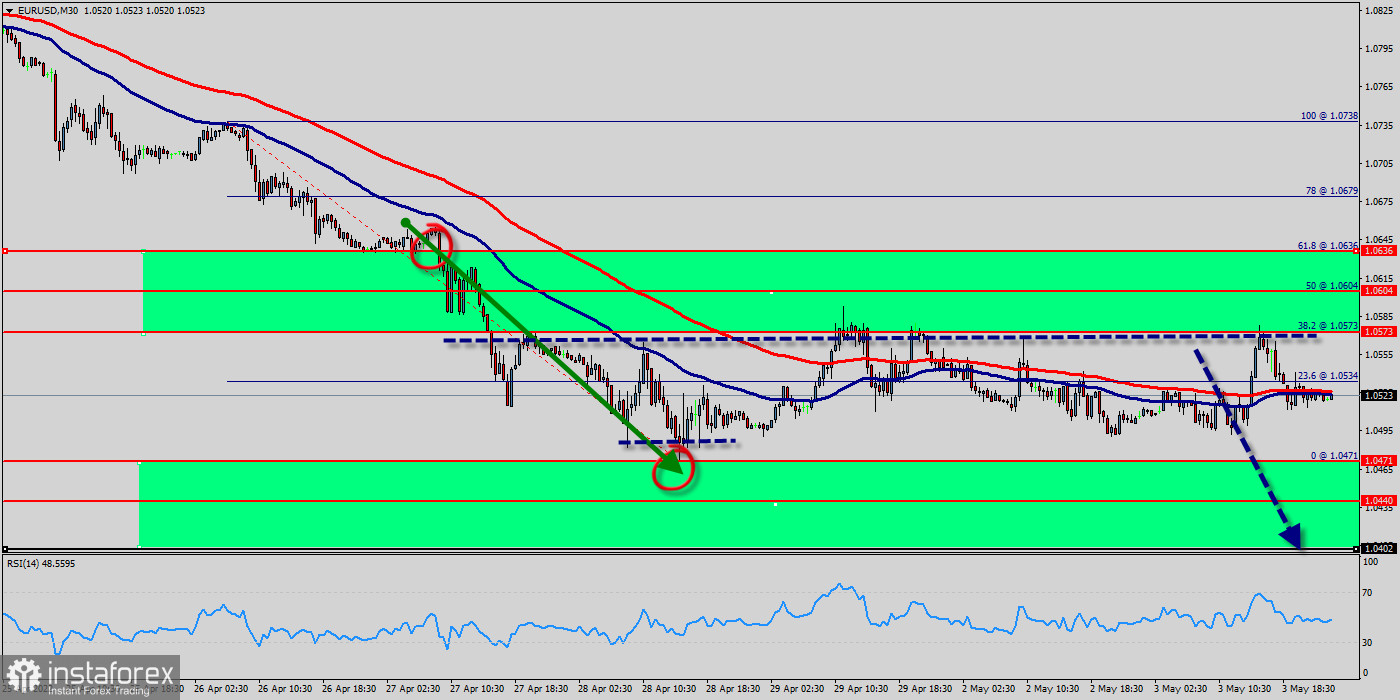
The EUR/USD pair continues moving downwards from the level of 1.0573 this morning. Today, the first resistance level is currently seen at 1.0573, the price is moving in a bearish channel now. According to the previous events, we expect the EUR/USD pair to trade between 1.0573 and 1.0471. So, the support stands at 1.0471, while daily resistance is found at 1.0573. Today, the first support level is seen at 1.0471, and the price is moving in a bearish channel now. Furthermore, the price has been set below the strong resistance at the level of 1.0604, which coincides with the 50% Fibonacci retracement level. This resistance has been rejected several times confirming the downtrend. Additionally, the RSI starts signaling a downward trend. Therefore, the market is likely to show signs of a bearish trend around the spot of 1.0573. In other words, sell orders are recommended below the spot of 1.0573 with the first target at the level of 1.0471 and continue towards 1.0440 in order to test the weekly support 2 on the M30 chart. On the other hand, if the GBP/USD pair succeed to break through the weekly pivot point level of 1.0604 today, the market will move upwards continuing the development of the bullish trend to the level 1.0738 (double top).


