


A potential breakdown below the neckline of a skewed head and shoulder top ($35 k).
The BTC started a major decline after it failed to clear $ 35k against the US Dollar. BTC/USD traded below the $30,297 support to enter a bearish zone.
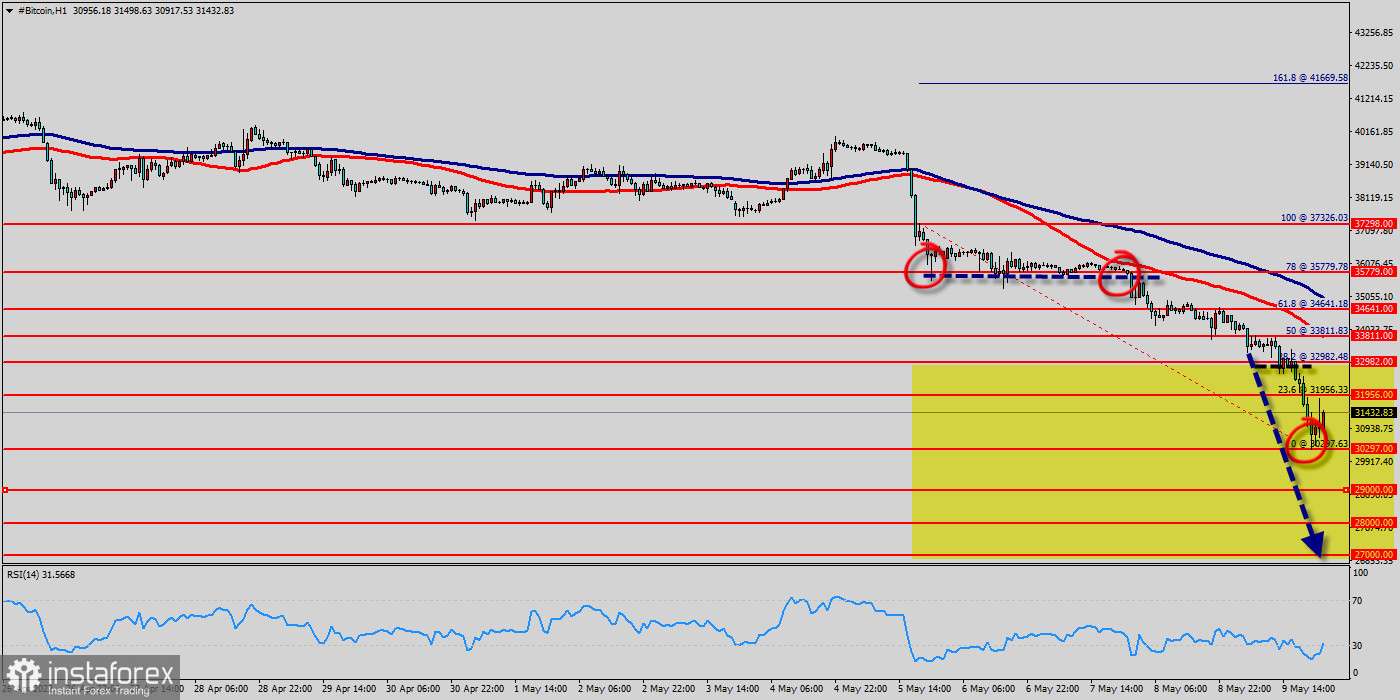
The price of bitcoin has been plummeting with strong bearish momentum, resulting in a break below the 50-day and 100-day moving averages lines on the daily timeframe, indicating that the bears are presently in control of the market.
Looking at the 1-hour chart, the pair settled below the $31,956 price, the 100 simple moving average (red, 1-hour), and the 50 simple moving average (blue, 1-hour).
The $30 K demand zone remains the next significant level of support for Bitcoin. Given the market's bearish momentum and sentiment, another bearish swing towards the $29 K support level looks imminent.
There was a clear move below the $30 K support zone. A low was formed near $30 K and the pair is now consolidating losses. If there is a recovery wave, the pair could face resistance near the $32 k price.
Currently, this metric is showing high values once again which could point to more downside for the price in the short term.
The RSI indicator has crossed into the oversold territory. This might result in a short-term rebound that will form a lower high, indicating the start of a new bearish trend.
Bitcoin is at an all-time high since many years against the dollar around the spot of $ 30k - BTC is inside in downward channel. Closing beloww the major support ($ 33k, $ 33k and $ 31k) could assure that BTC/USD will move lower towards cooling new lows.
BTC is continuing dropping by market cap at 5% in a day, 29% in a week, and 120% in a month, and is trading at $29 k after it reached $30,297 earlier.
BTC has been set below the strong resistance at the price of $32 k, which coincides with the 23,6% Fibonacci retracement level. This support has been rejected three times confirming the veracity of an uptrend. The breakdown of $30,297, will allow the pair to go further down to the prices of $29 k and $28 k.
Downtrend scenario :
On the downside, the $30,297 level represents support. The next major support is located near the $29 k, which the price may drift below towards the $28 k support region.


