


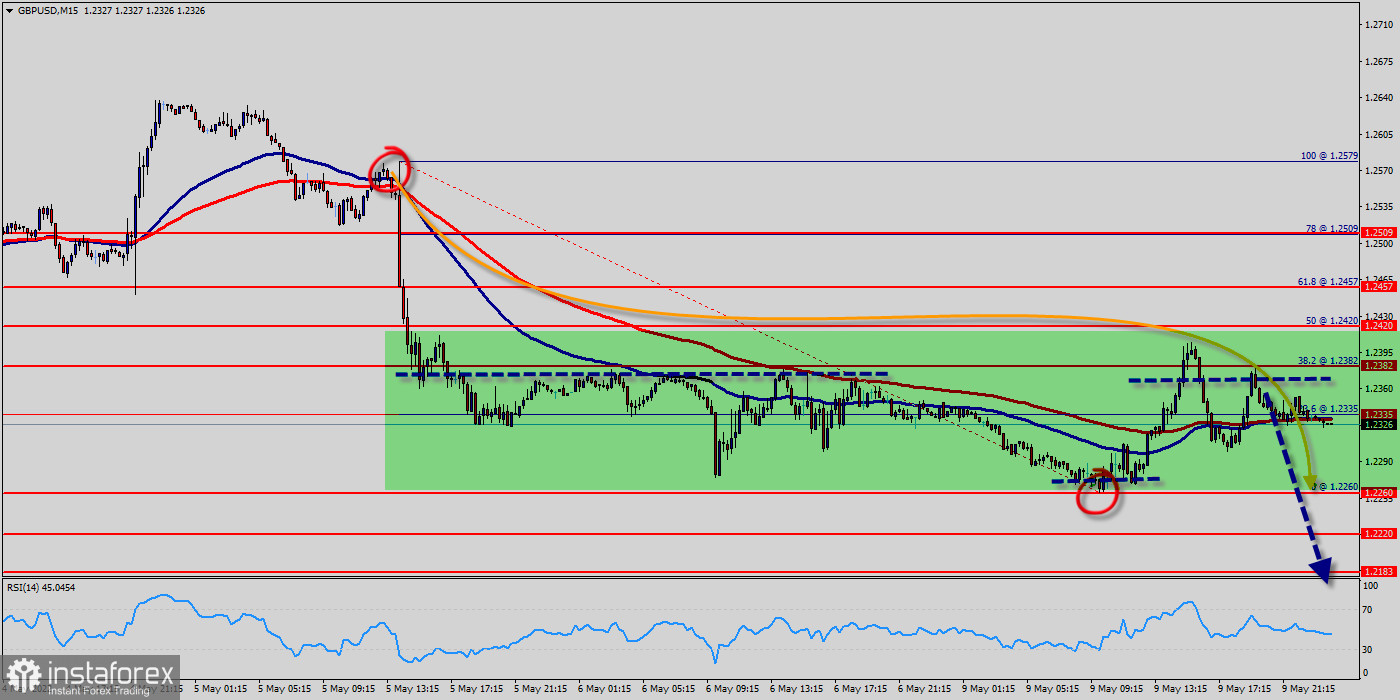
- Pivot : 1.2382.
- Time frame : M15.
The GBP/USD pair continues moving in a bearish trend from the resistance levels of 1.2420 and 1.2382. Currently, the price is in a bearish channel. This is confirmed by the RSI indicator signaling that we are still in a bearish trending market. As the price is still below the moving average (100), immediate resistance is seen at 1.2382, which coincides with a golden ratio (38.2% of Fibonacci).
Today, the first resistance level is seen at 1.2420 followed by 1.2382, while daily support is seen at the levels of 1.2260 and 1.2220. According to the previous events, the GBP/USD pair is still trapping between the levels of 1.2420 and 1.2260. Hence, we expect a range of 160 pips.
Today, the GBP/USD pair continues to move downwards from 1.2382 level. The pair fell from 1.2420 level to the bottom around 1.2327.
In consequence, the GBP/USD pair broke support at 1.2382 which turned into resistance. The 1.2382 level is expected to act as major resistance.
Hence, we expect the GBP/USD pair to continue moving in the bearish trend from 1.2382 level towards the target at 1.0872. In the long term, if the pair succeeds in passing through 1.2260 level , the market will indicate the bearish opportunity below 1.2260 level in order to reach the second target at 1.2220 in the M15 time frame.
However, the 1.2220/1.2260 mark remains a significant support zone. Thus, the trend will probably rebound again from 1.2260 level as long as this level is not breached.


