


GBP/USD Sideways Movement!
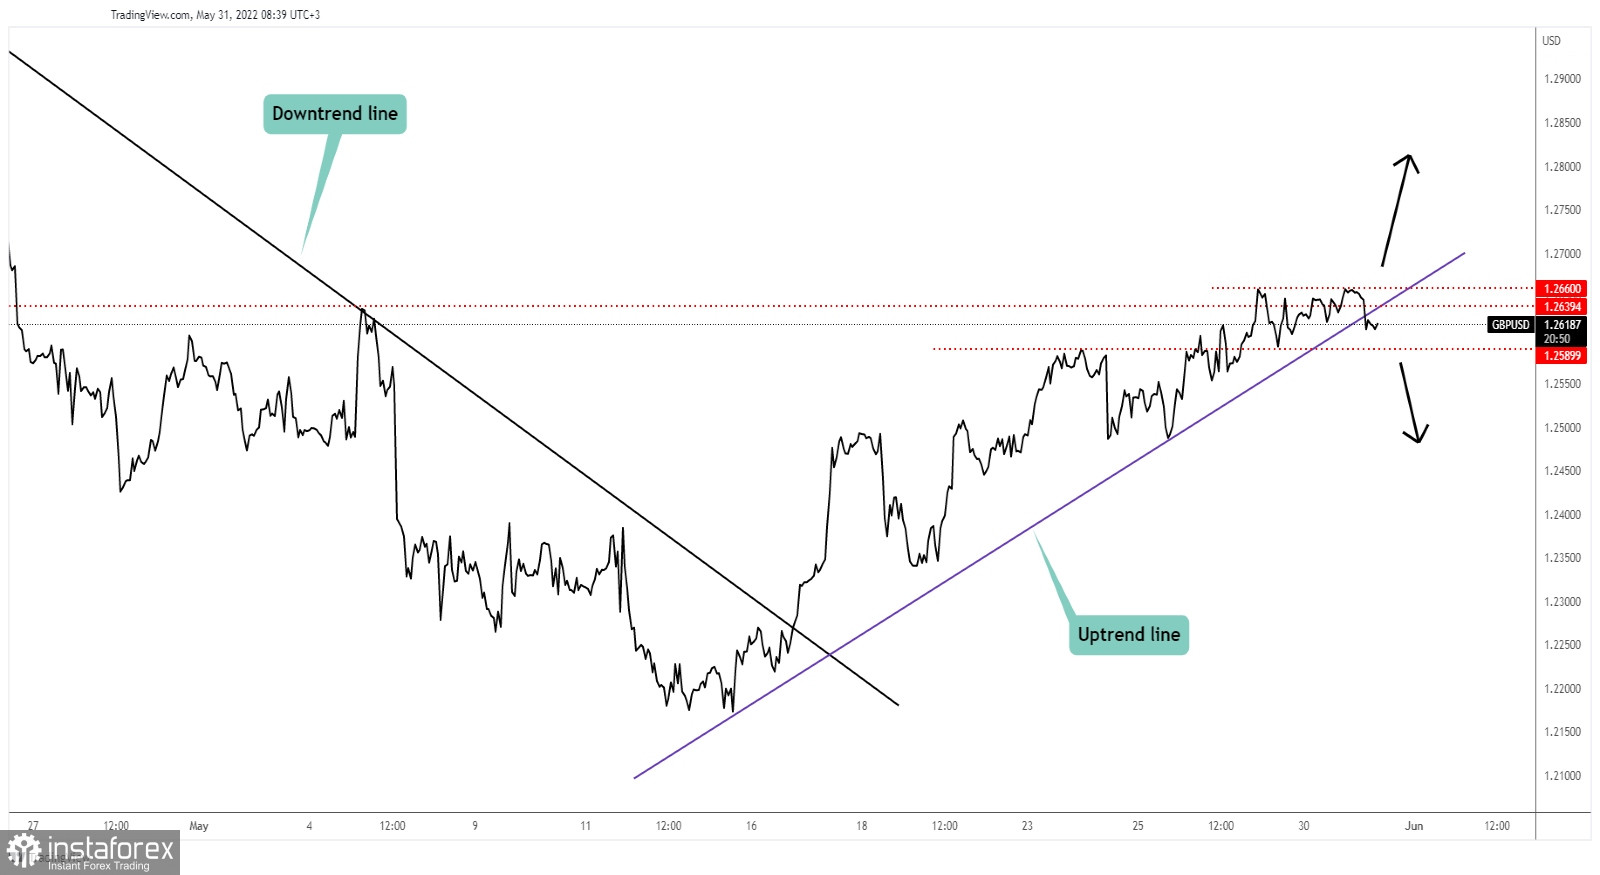
The GBP/USD pair was trading at 1.2619 at the time of writing. As you can see on the H1 chart, the price failed to jump above 1.2660 former high and now it has dropped below 1.2639 key level (former high) and below the uptrend line which represents a downside obstacle.
1.2660 former high is seen as an upside obstacle, while the 1.2589 former low stands as a downside obstacle.
GBP/USD Trading Conclusion!
Staying below 1.2639 - 1.2660 and dropping under 1.2589 could signal that the upside movement ended and that the price could develop a larger drop. This scenario could bring new selling opportunities.
On the other hand, staying above 1.2589 and jumping above 1.2660 could activate further growth and could bring new buying opportunities.


