Crypto Industry News:
The US Federal Reserve is beginning the process of reducing its balance sheet by approximately $ 7.5 trillion. What does this mean for the cryptocurrency market?
Laymen may view quantitative tightening (QT) as the opposite of quantitative easing (QE) or money printing. The Fed has been doing the latter on an unprecedented scale since the beginning of the COVID-19 pandemic. In QE, more money is created and distributed, while the central bank adds bonds and other treasury instruments to its balance sheet.
Except now the Fed plans to cut its balance sheet by $ 47.5 billion a month. This process is expected to take the next three months. In September this year, the bank plans a cut of as much as $ 95 billion. This is to ultimately reduce the balance sheet by $ 7.6 trillion by the end of 2023.
The Fed is therefore selling assets stronger and faster than many analysts expected and it is hard to imagine that this will not have any impact on investor sentiment in various markets. It is possible that the recent declines in the cryptocurrency market were caused not only by the collapse of the UST, but also by the Fed's decision.
Nevertheless, market reactions to QT will still take place, but to a minimal extent as the bank's policy change is already priced in. There may still be a reflex reaction in the markets due to the unexpected speed with which QT is introduced, but a significant proportion of investors are expected to have an inevitable rebound in the market, meaning investors should position their portfolios to take advantage of this.
Let's take a look at the US macroeconomic situation. You can see, among others wage increases, especially in the hospitality industry. Demand for employees is also high. Assuming wages remain high throughout the QT implementation period, the US could emerge from the economic crisis with less income inequality.
Technical Market Outlook:
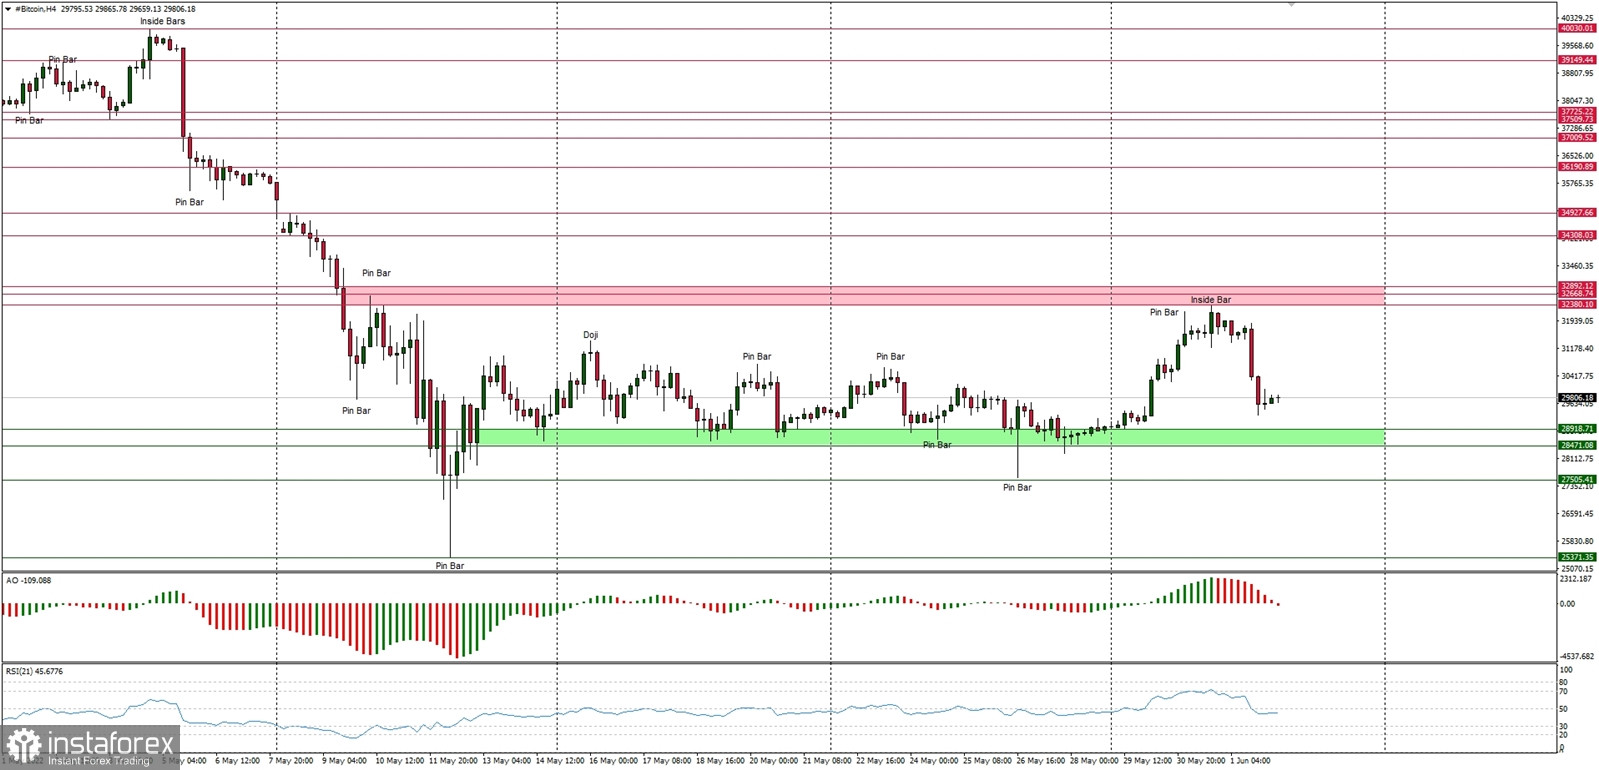
The BTC/USD pair relief rally had been terminated at the key short-term supply zone located between the levels of $32,380 - $32,892. The local high was made at the level of $33,370 and then the market reversed below the technical support seen at $30,000. The market keeps making lower lows and lower highs on the H4 time frame chart, so the down trend is intact. The first indication of the deeper correction would be a clear breakout above the range high located at the level of $32,870.
Weekly Pivot Points:
WR3 - $33,360
WR2 - $32,016
WR1 - $30,581
Weekly Pivot - $29,009
WS1 - $27,632
WS2 - $25,903
WS3 - $24,538
Trading Outlook:
The down trend on the H4, Daily and Weekly time frames continues. So far every bounce and attempt to rally is being used to sell Bitcoin for a better price by the market participants, so the bearish pressure is still high. The key long term technical support is seen at the round psychological level of $20,000.