


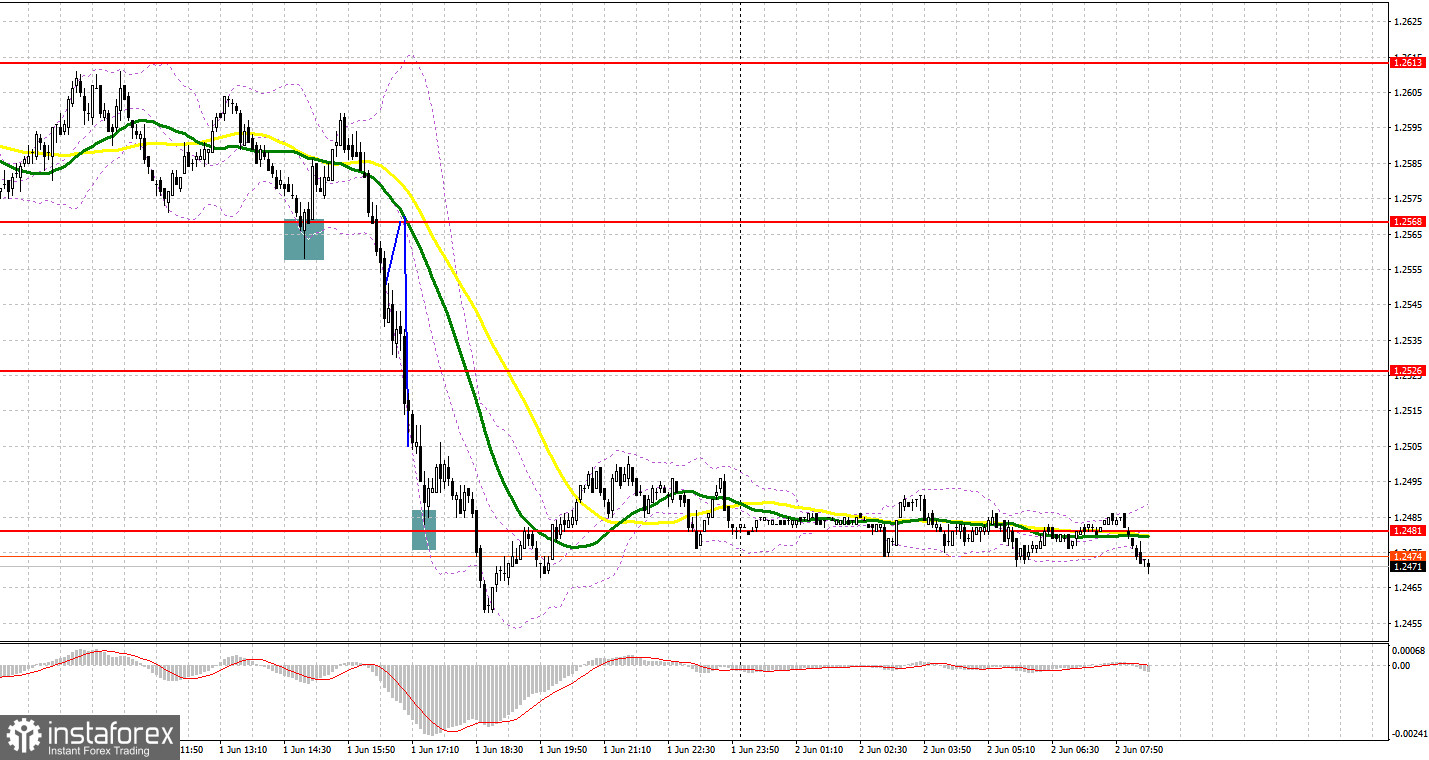
Yesterday, several market entry signals were formed. Let's take a look at the 5-minute chart and see what happened. I paid attention to the level of 1.2613 and the level of 1.2568 in my morning forecast. Given that the data on manufacturing activity in the UK was not surprising, I did not see much movement in the GBP/USD pair in the first half of the day. A false breakout at 1.2613 was not enough to open short positions, which we missed by a few points. Similarly, several points were missing before 1.2568 was tested and before forming a false breakout there with a signal to buy the pound. Everything changed during the US session: 1.2568 was still tested, as well as a false breakout at this level, which led to a buy signal and enabled us to get 30 points of profit from the market. After surpassing 1.2568, I did not see a reverse test of this level (marked with blue lines on the chart), so I missed the downward movement. Long positions on the rebound from 1.2481 brought their own 20 points of correction.
When to go long on GBP/USD:
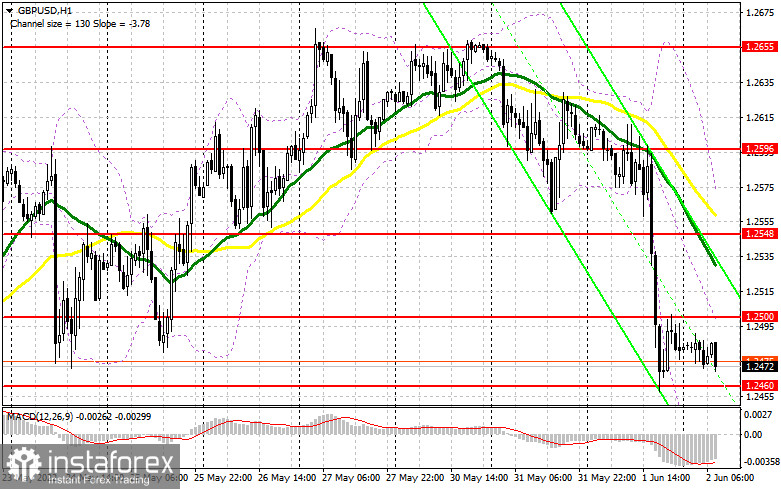
It is quite expected that today the pound will continue its downward correction. Considering that the UK will not publish data today, we can only hope for the divergence that appears on the MACD indicator and for the protection of support at 1.2460. If there is no active upward movement in the near future, forming a false breakout there will lead to a signal to open new long positions in anticipation of the resumption of the bullish trend, which now has every chance of ending as quickly as it began. The bulls will also estimate at the 1.2500 intermediate resistance, which needs to be returned - if the bulls, of course, plan to maintain the bull market. We can expect a sharper movement from the pair, but only after settling above this range with a reverse test from top to bottom, which will open the way to a high of 1.2548, where the moving averages, playing on the bears' side, pass. A breakthrough of this range will return the GBP/USD to the resistance area: 1.2596 and 1.2655, where I recommend taking profits.
If the pound falls and there are no bulls at 1.2460, the pressure on the pair will only increase. This will make it possible to reach 1.2411, which will completely cross out the upward trend of May. For this reason, I advise you not to rush into long positions. It is best to enter the market after a false breakout at this level. I advise you to buy GBP/USD immediately on a rebound from 1.2411, or even lower - in the region of 1.2371 with the goal of correcting 30-35 points within the day.
When to go short on GBP/USD:
The bears need to maintain their dominance in the market, and the only way to do this is to defend the nearest resistance at 1.2500. This level may be tested at the beginning of the European session, so forming a false breakout there will provide a signal to open new short positions in anticipation of a further downward correction of the pair. An equally important task is to settle below 1.2460 - the level formed on the basis of yesterday. A breakthrough and reverse test from the bottom up of this range will create a sell signal, making it possible for GBP/USD to return to the 1.2411 area, opening a direct path to a low like 1.2371, where I recommend taking profits. The next target would be a low of 1.2331, which would completely cancel out the bull market.
If GBP/USD grows and there is no activity at 1.2500, there may be a slight upsurge amid the dismantling of bears' stop orders, who expect the pair to continue falling this week. In this case, I advise you to postpone short positions until the next resistance at 1.2548, where the moving averages pass. I advise you to sell the pound there only in case of a false breakout. Short positions immediately for a rebound can be made from the high of 1.2596, or even higher - from 1.2655, counting on the pair's rebound down by 30-35 points within the day.
COT report:
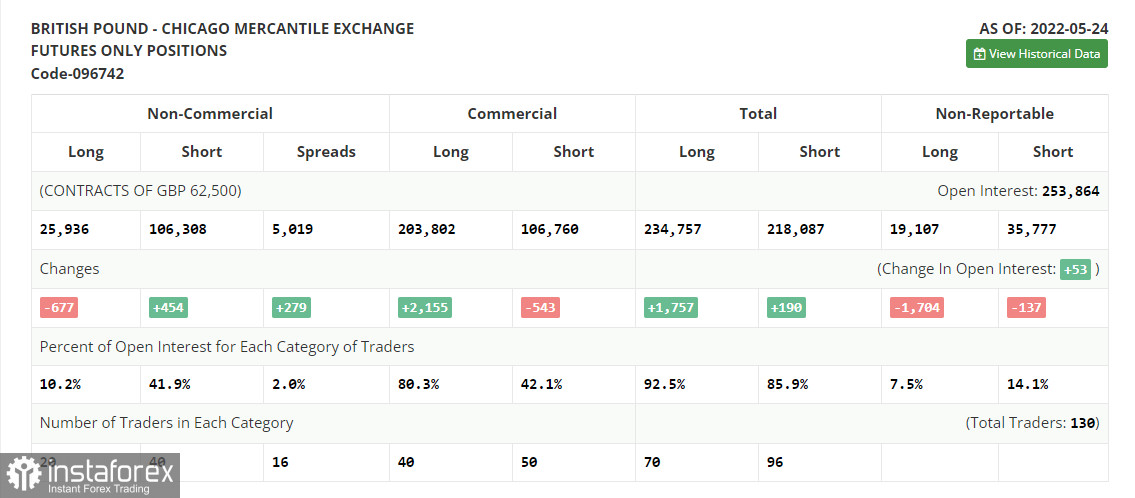
The Commitment of Traders (COT) report for May 24 showed that long positions decreased while short positions increased. However, this did not significantly affect the balance of power. Despite the pound's growth since the middle of this month, the market remains completely under the bears' control.
Apparently, only the absence of fundamental statistics, to which the pair has been reacting rather negatively lately, and a slight profit-taking from annual lows have enabled the GBP/USD to recover slightly. There are no other objective reasons for growth. The economy continues to slide into recession, inflation hits new records, and the cost of living in the UK is steadily rising. The Bank of England continues to rush between two fires, but despite all this, BoE Governor Andrew Bailey continues to say that the central bank is not going to refuse to raise interest rates yet. The widespread rumors that the US central bank plans to "pause" the cycle of raising interest rates in September this year continue to gain momentum, which puts some pressure on the US dollar and leads to the strengthening of the pound.
The COT report indicated that long non-commercial positions decreased by -667 to 25,936, while short non-commercial positions rose by 454 to 106,308. This led to an increase in the negative value of the non-commercial net position from -79,241 to -80,372. The weekly close rose from 1.2481 to 1.2511.
Indicator signals
Moving averages
Trading is below the 30 and 50-day moving averages, which indicates a continuation of the pair's correction.
Note: The period and prices of moving averages are considered by the author on the H1 hourly chart and differs from the general definition of the classic daily moving averages on the daily D1 chart.
Bollinger Bands
In case of a decline, the lower border of the indicator around 1.2425 will act as support. In case of growth, the area of 1.2550 will act as resistance.
Description of indicators
- Moving average (moving average, determines the current trend by smoothing out volatility and noise). Period 50. It is marked in yellow on the chart.
- Moving average (moving average, determines the current trend by smoothing out volatility and noise). Period 30. It is marked in green on the chart.
- MACD indicator (Moving Average Convergence/Divergence — convergence/divergence of moving averages) Quick EMA period 12. Slow EMA period to 26. SMA period 9
- Bollinger Bands (Bollinger Bands). Period 20
- Non-commercial speculative traders, such as individual traders, hedge funds, and large institutions that use the futures market for speculative purposes and meet certain requirements.
- Long non-commercial positions represent the total long open position of non-commercial traders.


