


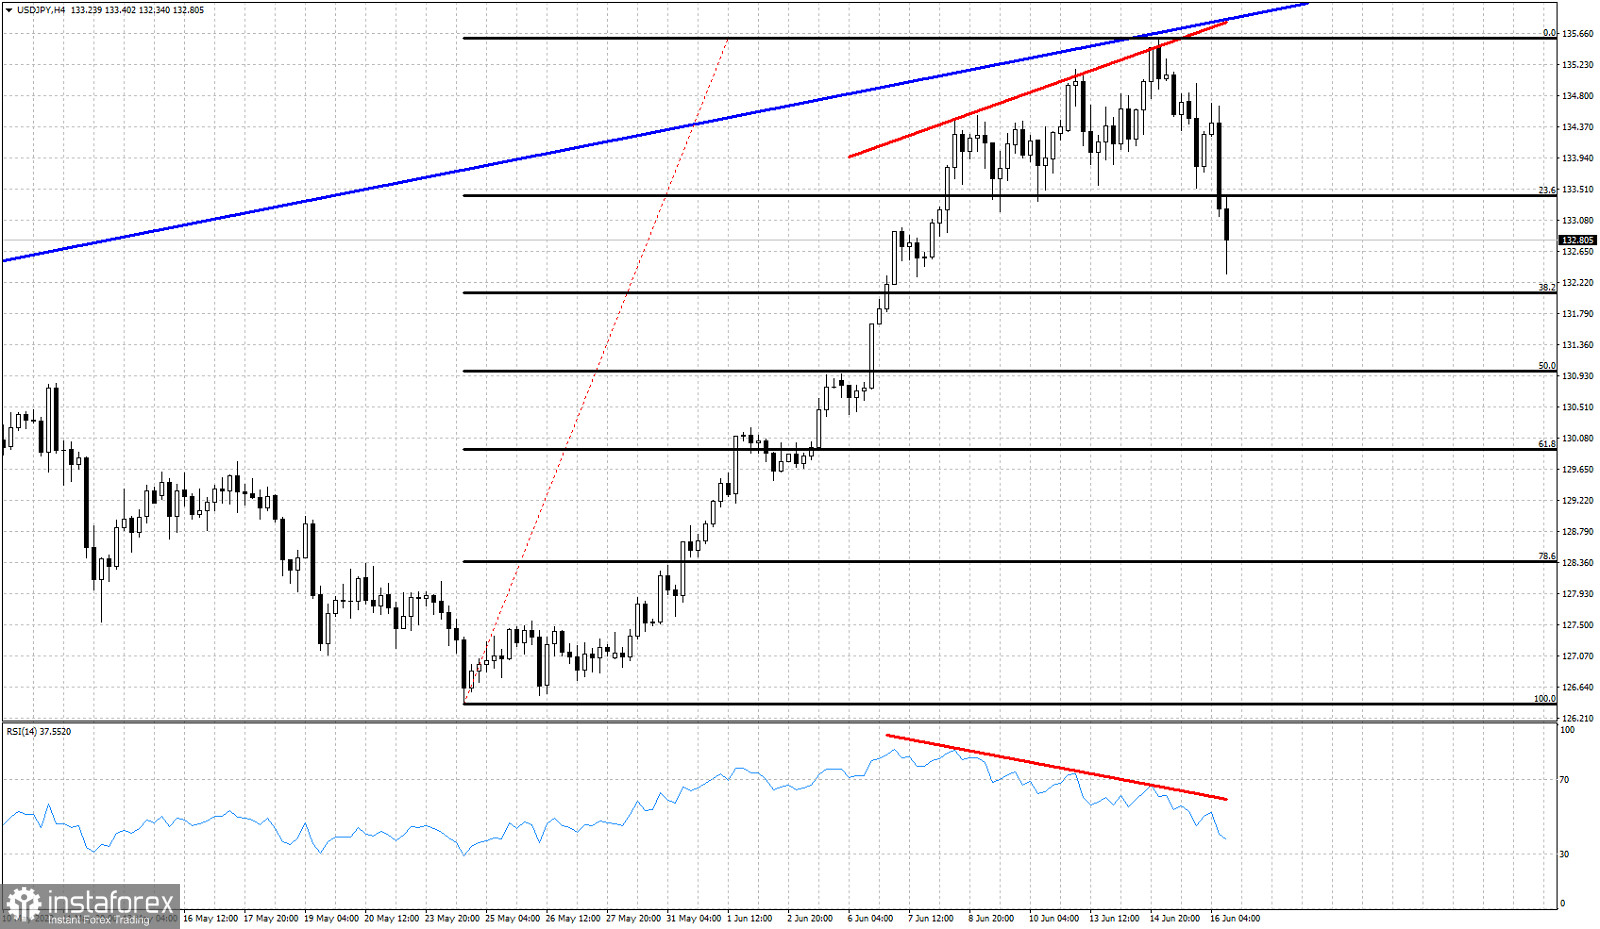
Red lines- bearish divergence
Black lines- Fibonacci retracements
Blue line- major resistance trend line
USDJPY is trading around 132.80 after making a high at 135.60. Traders were warned by our timely analysis that a reversal was imminent after a new higher high above 135. The signs were there and the RSI suggested the weakening of the up trend. USDJPY broke below the short-term support of 133.90 and is now 100 pips lower already. Today's low was at 132.34 as price has almost reached the 38% Fibonacci retracement of the rise. Fibonacci support is found at 132.07 and next at 130-129.90. USDJPY is now in a corrective phase to retrace the upward move from May lows. We should not forget the inverted head and shoulders pattern that is active and gives us much higher targets for the next few months. As long as price holds above 125 the bullish scenario remains intact.


