Technical outlook:
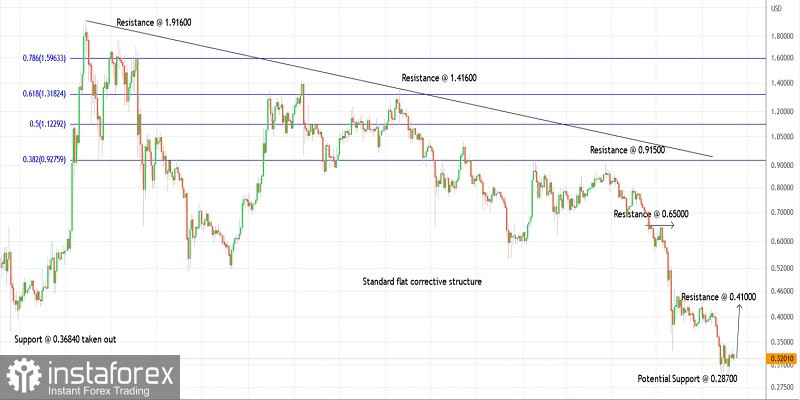
Ripple rose above $0.3370 on Tuesday before finding resistance as bears came back strong. The crypto developed a bearish shooting star candlestick pattern on the daily chart indicating a potential turn lower. It is seen to be trading close to $0.3210 at this point in writing and it is expected to drag further towards $0.30600 in the near term.
Ripple seems to have completed/terminated its larger degree corrective wave, which began from $1.91600 in April 2021. The corrective drop has unfolded as a standard flat (3-3-5) structure completing around $0.28700. If the above-proposed structure holds well, prices would stay above $0.28700 and push higher through the $0.41000 initial resistance soon.
Ripple has also managed to carve a lower degree upswing like most of its peers in the past three trading sessions between $0.28700 and $0.33700. Prices are currently retracing following the above upswing. The token is expected to find support close to $0.30600, which is the Fibonacci 0.618 retracement of the above move (not shown here today). Watch out for a bullish turn thereafter.
Trading plan:
Potential short-term drop through $0.30600, then rally through $0.41000 at least against $0.28700
Good luck!


