


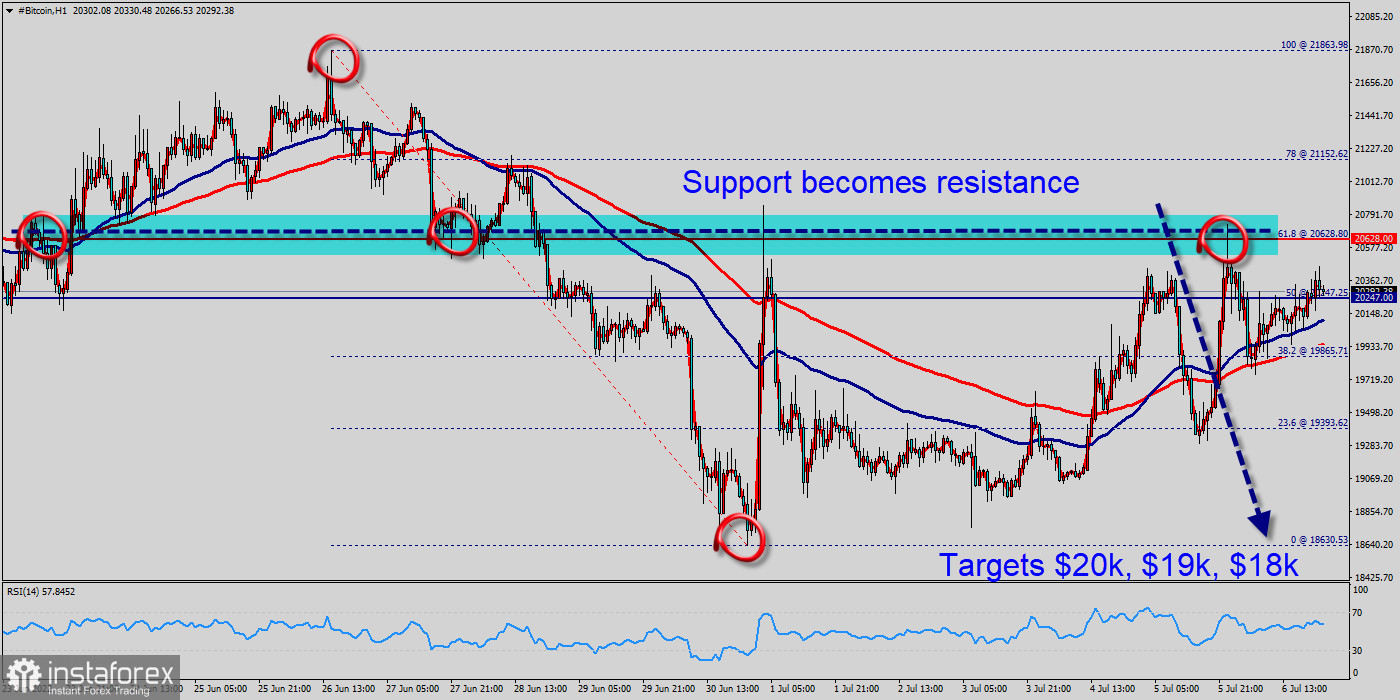
Bitcoin stayed below the psychological level of $20,628 over the weekend, indicating a lack of urgency to accumulate at the current levels. The bears are attempting to extend BTC's decline below $20,628 in the week beginning of this week. Following the price of $20,628 rejection, the seller takers still have the upper hand in the market, as they were able to impose more correction on BTC from the price of $20,628. The BTC/USD pair couldn't reached stiff resistance at $20,628 and pulled back near $20,247 support, which could be a swing entry opportunity. Also, it should be noticed that the support becomes a resistance at the price of $20,628. Previously, price broke out from triangle and below $20,628 (lower low), which signaled trend to continue towards the south. This was marginally below the long-term floor of $20,247 for bitcoin, and comes as prices failed to break out of yesterday's resistance at $20,628. The level of $20,247 coincides with a major ratio (50% of Fibonacci), which is expected to act as major resistance today. The Relative Strength Index (RSI) is considered oversold because it is below 60. The RSI is still signaling that the trend is downward as it is still strong below the moving average (100). Additionally, the RSI starts signaling a downward trend. Bitcoin dropped from the level of $20,628 to the bottom around $19,393. But the pair has rebounded from the bottom of $19,393 to close at $20,247. If sellers continue to control the market, BTC can be expected to drop to retest the channel's bottom line at $19,865. On the downside, the $19,393 level represents support. The next major support is located near the $18,630, which the price may drift below towards the $18k support region. Next hours, the major support level is seen at $18,630, and the price is moving in a bearish channel incoming.
Forecast (BTC/USD) :
The volatility is very high for that the BTC/USD is still moving between $20,628 and $18,630 in coming days. Consequently, the market is likely to show signs of a bearish trend again. Hence, it will be good to sell below the level of $20,628 with the first target at $19,865 and further to $19,865 in order to test the weekly support. However, if the BTC/USD is able to break out the daily resistance at $21k, the market will rise further to $21,863 to approach resistance 2 today.
Conclusion :
Downtrend scenario :
On the downside, the $20,628 level represents resistance. The next major resistance is located near the $20,628, which the price may drift below towards the $19,393 support region. Further close below the low end may cause a rally towards $18,630. Nonetheless, the weekly support level and zone should be considered.
- Resistances levels are at: $20,628, $21,152, $21,863
- Support levels are at: $19,865, $19,393, $18,630


