


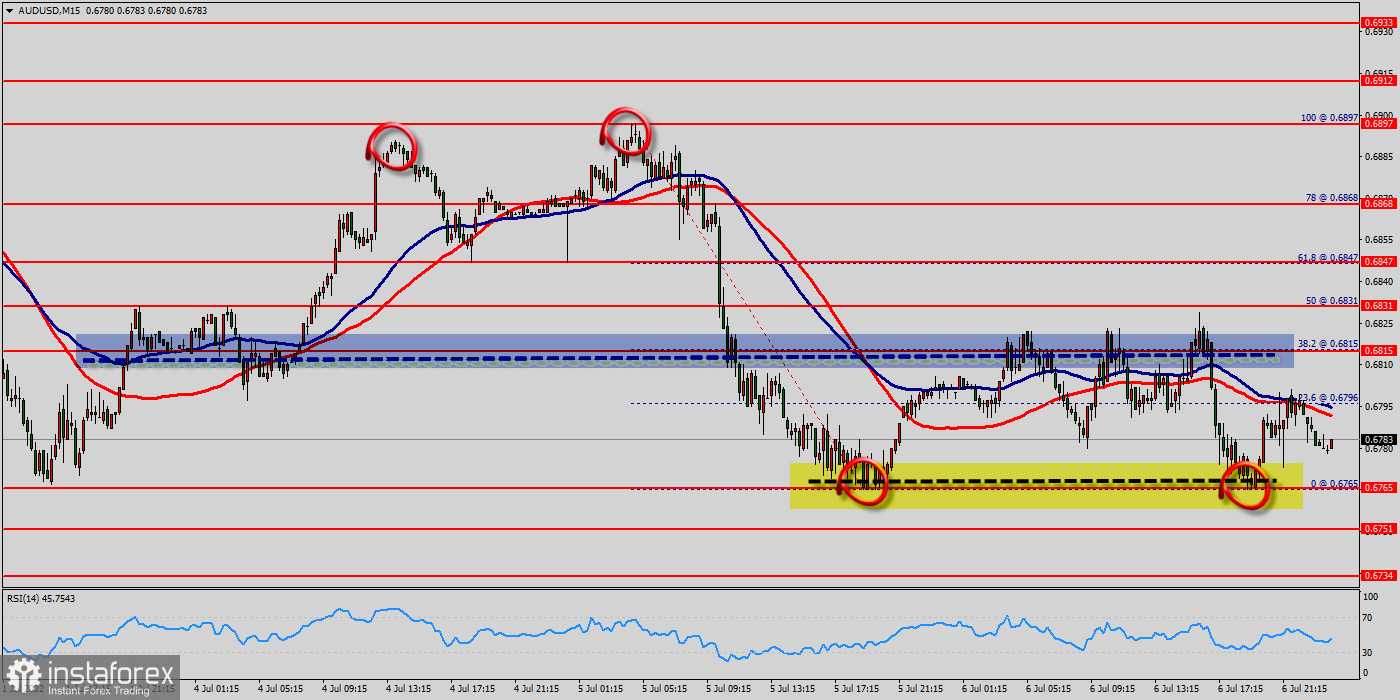
The bears mustn't break through 0.6815 in order to resume the downtrend. The trend of AUD/USD pair movement was controversial as it took place in the downtrend channel. Due to the previous events, the price is still set between the levels of 0.6765 and 0.6815, so it is recommended to be careful while making deals in these levels because the prices of 0.6815 and 0.6765 are representing the resistance and support respectively. Therefore, it is necessary to wait till the downtrend channel is passed through. Then the market will probably show the signs of a bearish market. In other words, sell deals are recommended below the price of 0.6815 with the first target at the level of 0.6765. From this point, the pair is likely to begin an descending movement to the price of 0.6815 with a view to test the daily support at 0.6751.
Forecast :
If the pair fails to pass through the level of 0.6815, the market will indicate a bearish opportunity below the strong resistance level of 0.6815. In this regard, sell deals are recommended lower than the 0.6815 level with the first target at 0.6765. It is possible that the pair will turn downwards continuing the development of the bearish trend to the level 0.6751. However, stop loss has always been in consideration thus it will be useful to set it above the last double top at the level of 0.6847 (notice that the major resistance today has set at 0.6847).
Daily key levels :
- Major resistance: 0.6847
- Minor resistance: 0.6831
- Pivot point: 0.6815
- Minor support: 0.6715
- Major support: 0.6751
Comment :
- - The trend is still calling for a strong bearish market from the spot of 0.6815.
- - Sellers are asking for a high price.
- - Please check out the market volatility before investing, because the sight price may have already been reached and scenarios might have become invalidated.
- - The price channel is a limited trading range in which the price moves during a certain period of time. In other words, it is a "corridor" on the price chart. The boundaries of the price channel are outlined by two lines: resistance and support.
- - A resistance level is a price level from which price reverses as it approaches from the bottom to the top. This level is as if it is resisting the price, preventing it from going higher.


