


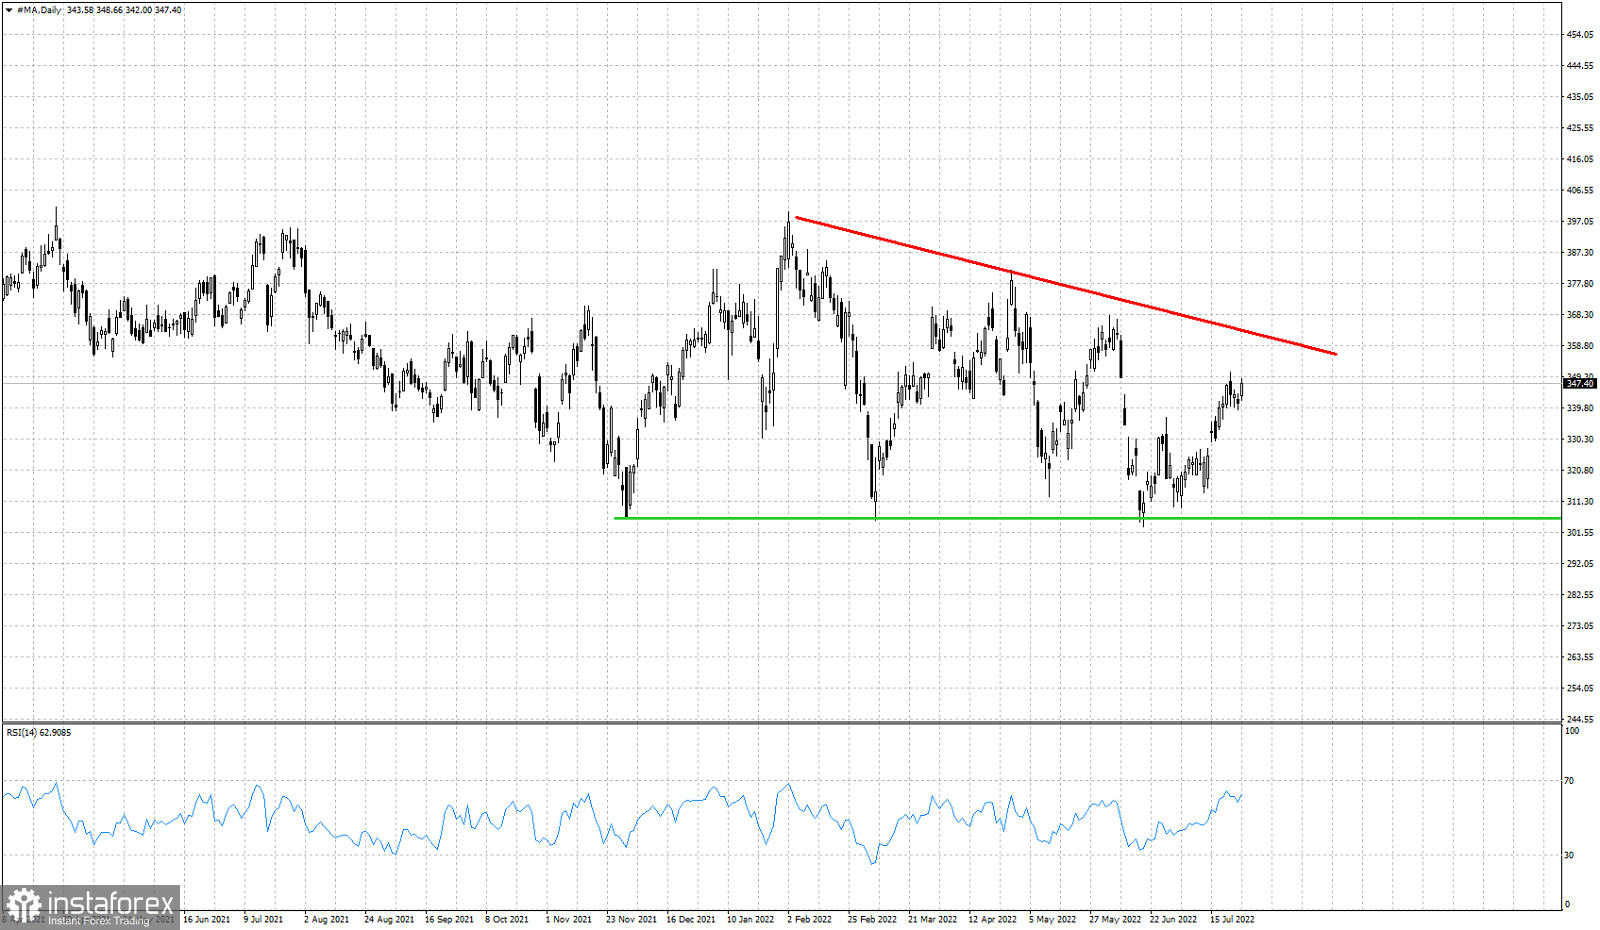
Red line- resistance trend line
Green line- horizontal support
MA stock price is in an bullish momentum after bottoming in mid June around $306 where we find the major horizontal support. In previous posts we noted the descending triangle formation MA stock price is in. Price has respected support at $306 and is bouncing higher towards the resistance of the triangle formation. MA stock price is making higher highs and higher lows in the Daily chart. Price remains below the red downward sloping resistance trend line. Will we see another lower high and rejection at the red trend line? If this is the case, then we should expect MA stock price to return towards the green horizontal support. The area around the red trend line resistance at $360, is key resistance and a very good level to open short positions.


