


Analyzing trades on Wednesday:
EUR/USD on 30M chart
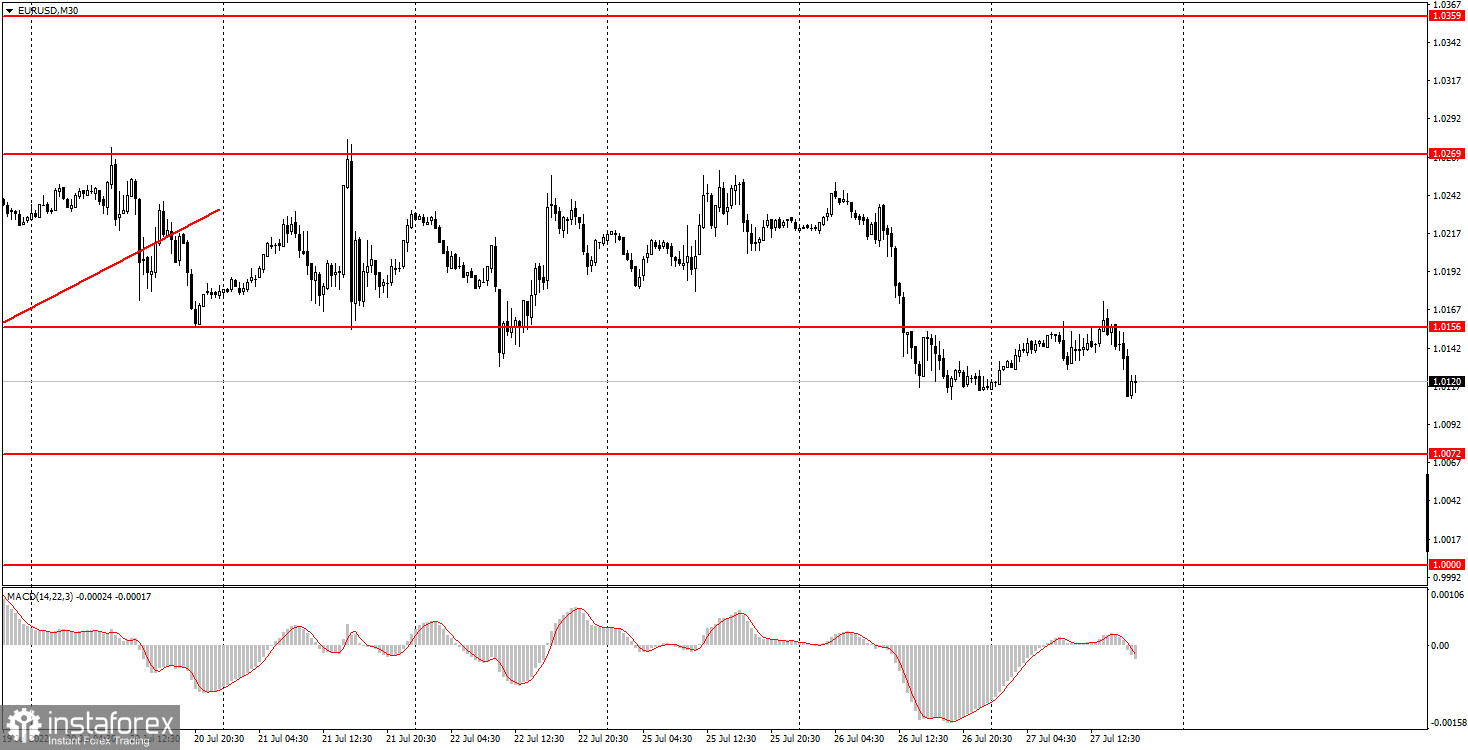
On Wednesday, EUR/USD was trading very slowly despite the upcoming announcement by the Fed. On Tuesday, the pair dropped by 120 pips, while yesterday the total volatility was observed within 60 pips. USD made another attempt to strengthen but struggled to retest the previous lows. In the past few days, the macroeconomic background in the US and EU was almost absent. There was only one important report in the US regarding the durable goods orders. The report exceeded analysts' expectations. Therefore, the rise in the US currency was justified. Yet, we expected to see a deeper fall in the pair. The fact that the Fed raised the rate by 0.75% is a very strong bullish factor for the greenback. For your reference, the US dollar has been showing upside dynamics for the past one and a half years. In the meantime, the European currency failed to perform a proper correction even once. That is why market participants were likely to buy USD beforehand as they were sure that the Fed would stick to its policy of monetary tightening.
EUR/USD on M5 chart
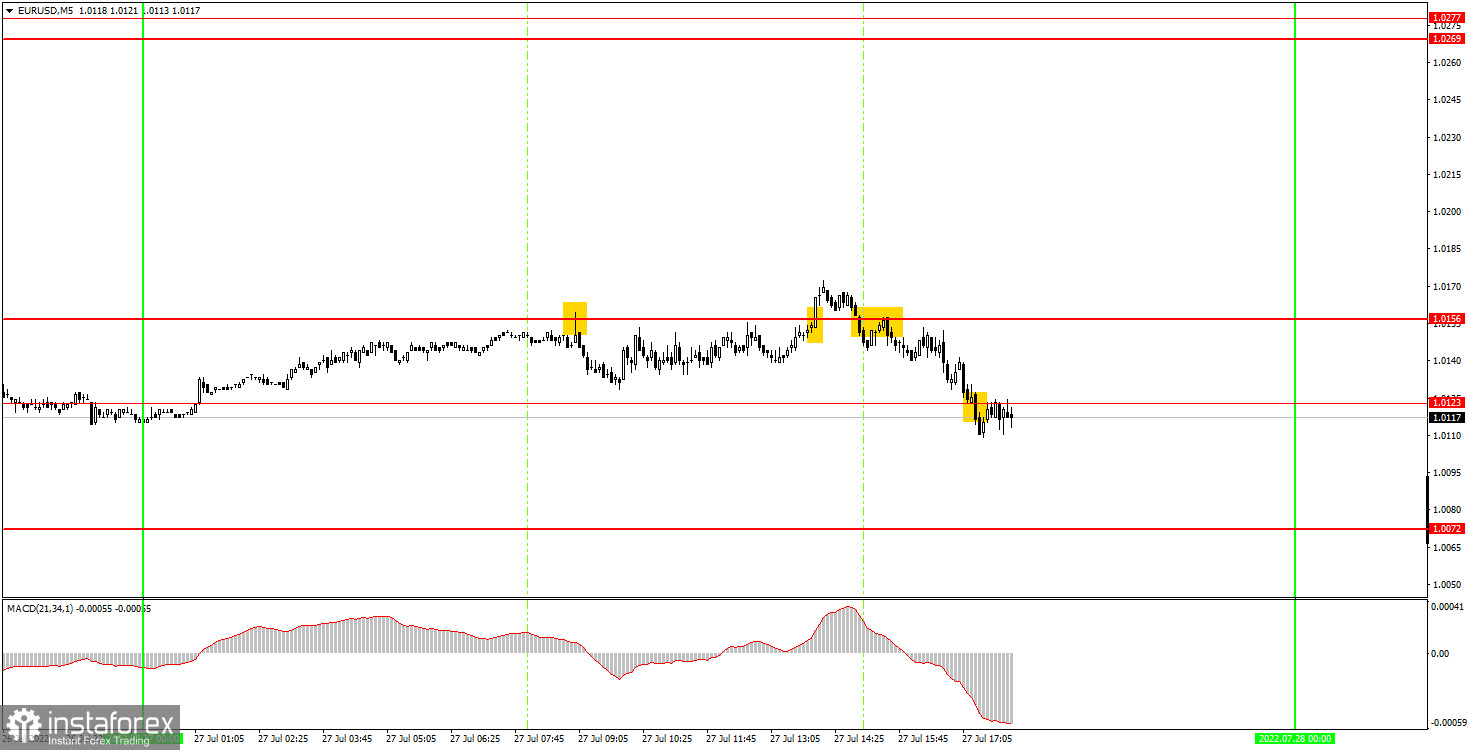
On the 5-minute time frame, trading was very sluggish yesterday. In the course of the European session, the pair showed no movement at all, while in the New York session, trading was a bit more active but still not enough to show a strong movement. Yet, we cannot rule out high volatility that may be caused by the Fed's decision. Jerome Powell's comments will also shape the sentiment of the market as they will give a hint about whether the regulator will maintain the same pace of monetary tightening. Trading signals were very weak yesterday and most of them were false. The first sell signal was formed when the price bounced off the level of 1.0156. After that, the quote failed to even reach the nearest level of 1.0123. Yet, I managed to set a Stop Loss to breakeven. The second buy signal that was formed following the consolidation above 1.0156 was 100% false. The price couldn't move in the right direction by even 15 pips. The third signal near 1.0156 should not have been followed at all. A sell signal near the level of 1.0123 was formed too late to be followed.
Trading tips on Thursday
On the 30-minute time frame, the uptrend was canceled and there are all signs that the euro will be extending its decline. The reason for this is the rate hike of at least 0.75% by the Fed. Yet, the reaction of the market can be unpredictable. On the 5-minute chart on Wednesday, it is recommended to trade from the levels of 0.9952, 1.0000, 1.0072, 1.0123, 1.0156, 1.0269-1.0277, and 1.0354. Set a Stop Loss to breakeven as soon as the price moves by 15 pips in the right direction. On Thursday, nothing important is expected to be published in the EU. Meanwhile, the US will release the data on GDP for the second quarter, according to which the US economy has expanded by 0.5-0.6%. However, the market may ignore this report although it is definitely the key indicator. On Thursday, market participants may still be under the impression from the Fed's announcement.
Basic rules of the trading system
1) The strength of the signal is determined by the time it took the signal to form (a rebound or a breakout of the level). The quicker it is formed, the stronger the signal is.
2) If two or more positions were opened near a certain level based on a false signal (which did not trigger a Take Profit or test the nearest target level), then all subsequent signals at this level should be ignored.
3) When trading flat, a pair can form multiple false signals or not form them at all. In any case, it is better to stop trading at the first sign of a flat movement.
4) Trades should be opened in the period between the start of the European session and the middle of the US trading hours, when all positions must be closed manually.
5) You can trade using signals from the MACD indicator on the 30-minute time frame only amid strong volatility and a clear trend that should be confirmed by a trendline or a trend channel.
6) If two levels are located too close to each other (from 5 to 15 pips), they should be considered support and resistance levels.
On the chart
Support and Resistance Levels are the levels that serve as targets when buying or selling the pair. You can place Take Profit near these levels.
Red lines are channels or trend lines that display the current trend and show in which direction it is better to trade now.
The MACD indicator (14, 22, and 3) consists of a histogram and a signal line. When they cross, this is a signal to enter the market. It is recommended to use this indicator in combination with trend patterns (channels and trendlines).
Important announcements and economic reports that can be found on the economic calendar can seriously influence the trajectory of a currency pair. Therefore, at the time of their release, we recommend trading as carefully as possible or exiting the market in order to avoid sharp price fluctuations.
Beginners on Forex should remember that not every single trade has to be profitable. The development of a clear strategy and money management is the key to success in trading over a long period of time.


