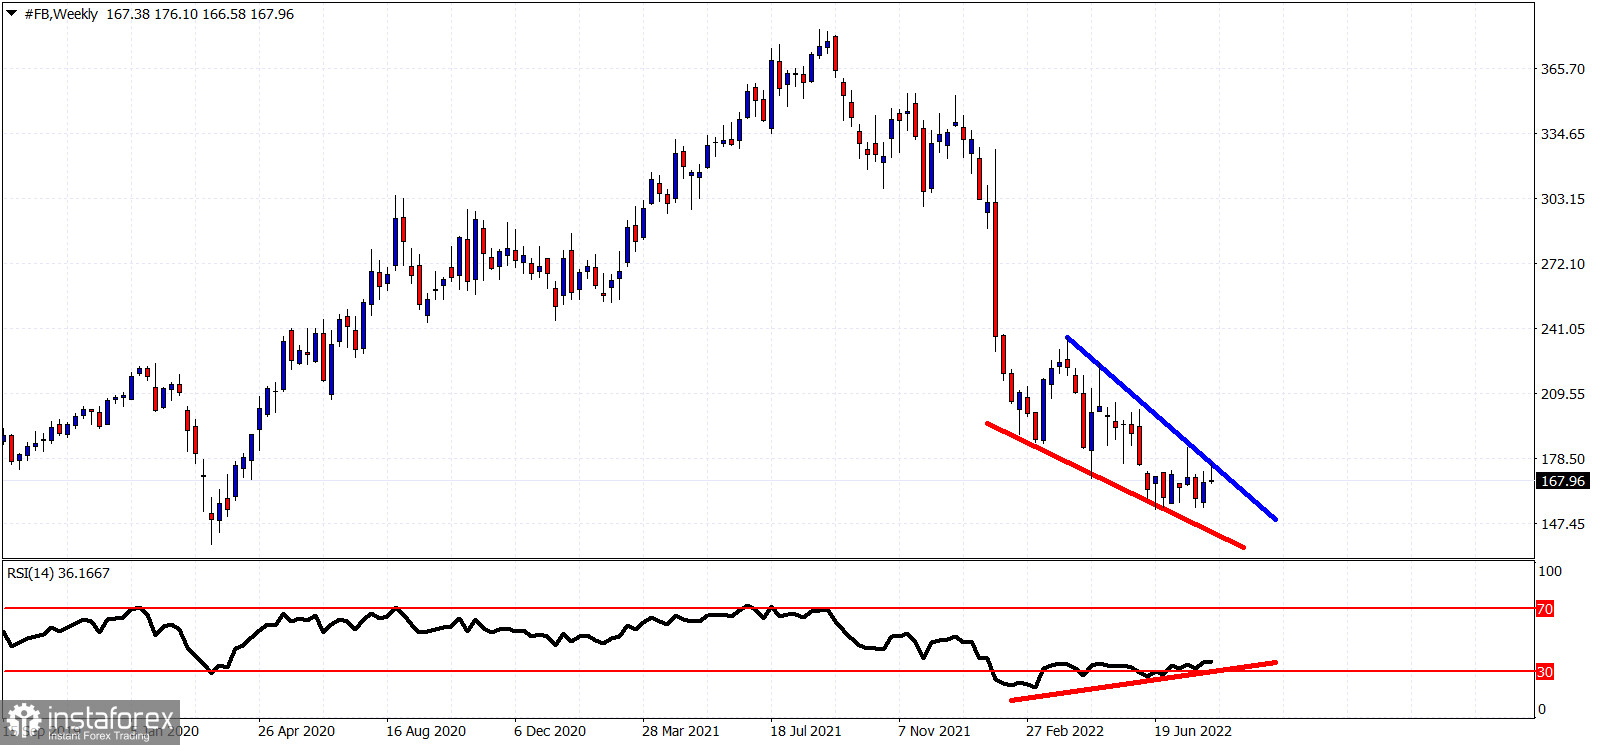
Red lines- bullish RSI divergence
Blue line- resistance
META (former FB) stock price remains in a bearish trend having declined from $384 to $155. Price has formed a downward sloping wedge pattern with several bullish RSI divergence signals. On a weekly basis price is making lower lows and lower highs but the RSI is not. The RSI shows that the down trend is weakening. Resistance is at $178 and a break above this level will produce a bullish signal. This would confirm the end of the downward move and the start of at least a counter trend bounce that could push price towards $240 where we find the 38% retracement of the entire decline.


