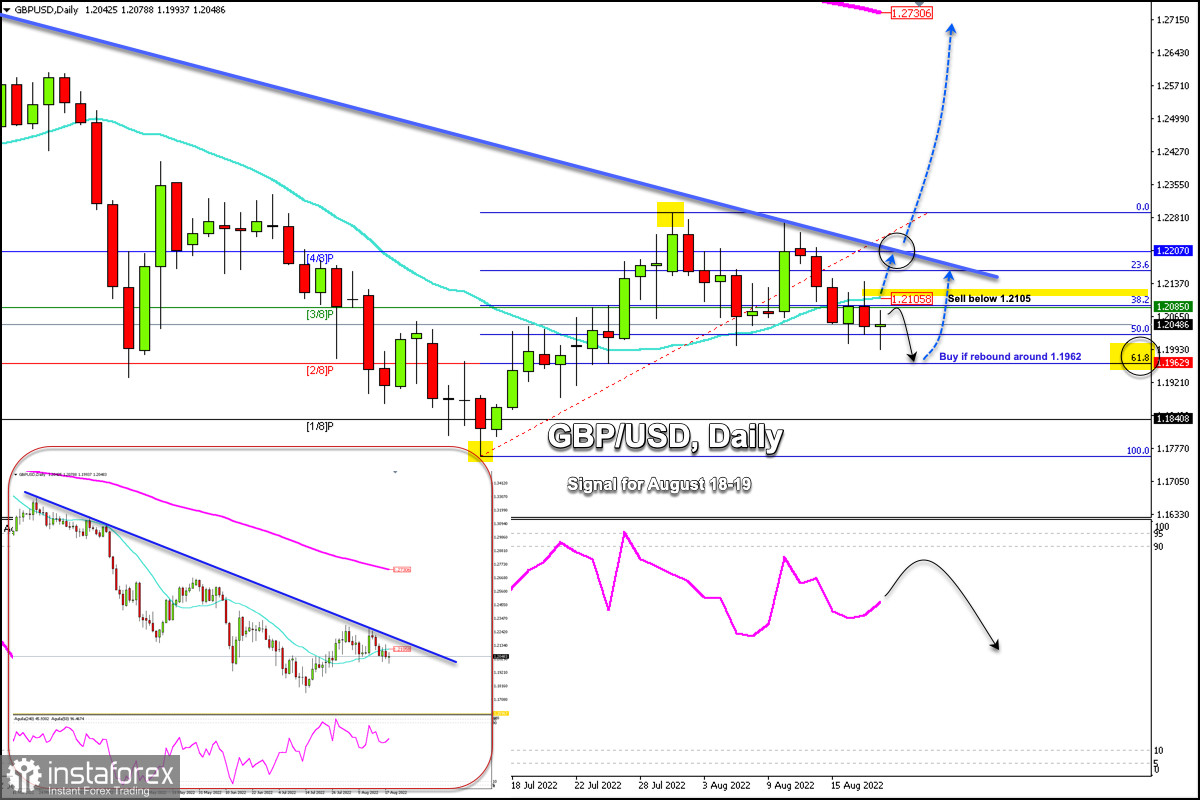
Early in the American session, the British pound is trading around 1.2048. A technical bounce is observed after the price has reached the minimum of 1.1994. This rebound could be seen as an opportunity to resume selling as the pound is under strong downward pressure.
On the daily chart, we can see that since March 15, the GBP/USD pair has been trading within a downtrend channel. On August 10, the pound tried to break through this channel but this attempt was unsuccessful. Since then, the pound has resumed its downward cycle.
On the daily chart, we can see that the pound is trading below the 21 SMA located at 1.2105 and below the 3/8 Murray located at 1.2085.
As long as it remains below this key level of 1.2105, the British pound is expected to remain under downward pressure and could reach the 61.8% Fibonacci zone around 1.1962 in the coming days.
The level of 2/8 Murray which coincides with the Fibonacci 61.8%, will be the key support for the British pound. In the event of a technical bounce above this level, there will be an opportunity to resume buying, and the price could reach the area of 1.2100 and 1.2207 (4/8 Murray). If the bullish force prevails, it could even break the downtrend channel and could reach the 200 EMA (daily charts) located at 1.2730.
The psychological level of 1.2000 could also act as a key zone for the British pound. The GBP/USD pair trading above this level will be seen as an opportunity for the bulls to buy.
Our trading plan for the next few days is to sell below 1.2105 with targets at 1.1962. On the contrary, we should expect the pound to approach the 61.8% Fibonacci zone around 1.1962 to buy, with targets at 1.2085 and 1.2207.


